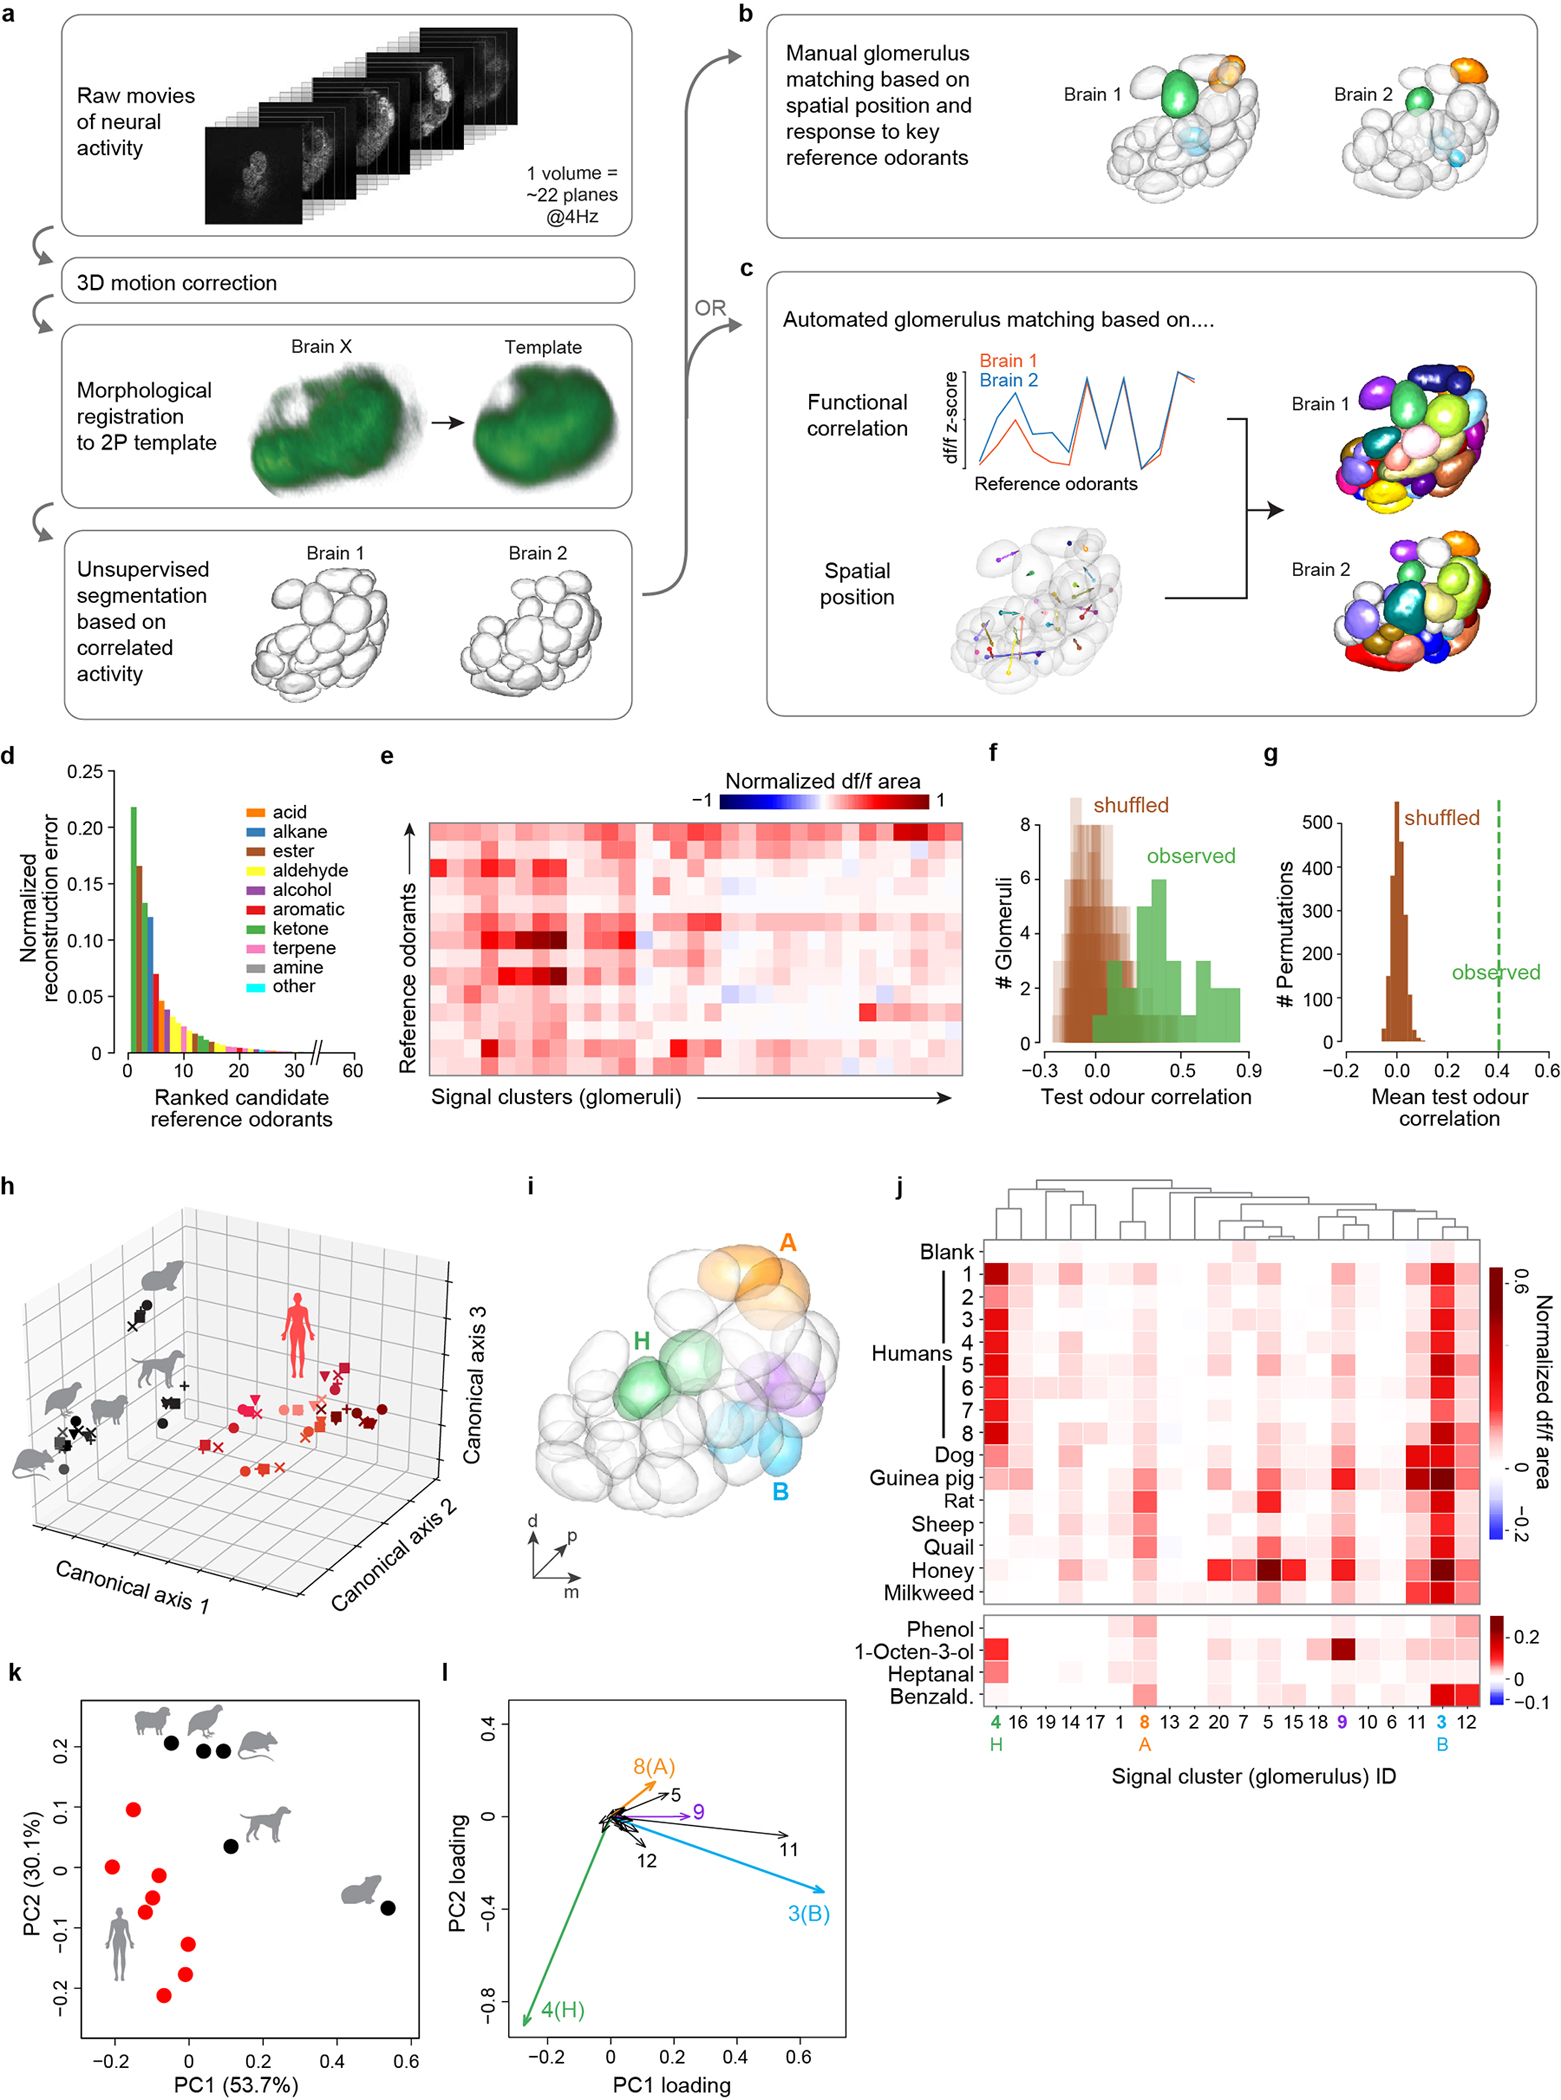
Extended Data Fig. 2 |. Automated analysis of volumetric antennal lobe imaging data.

a–c, Analysis pipeline schematic. After registration and unsupervised segmentation of all brains in a given data set (a), one brain was chosen as the reference and glomeruli from other brains were matched to those in the reference either manually (b) or using an automated pipeline (c). Colours in (b,c) show matched glomeruli (unmatched in white). Manual matching was performed for analyses focused on only B (cyan), H (green), and A (orange) glomeruli (Fig. 3,5). Automated matching, which provides a more global picture of activity but is less reliable for the three focal glomeruli, was used for the complementary analysis presented here (i–l). In both cases, matching was based on spatial position and response to 14 reference odorants. d, Reference odorants were chosen from among 60 candidates based on their ability to account for a large part of the observed signal variance/neural activity (see Methods). The 10 top-ranked odorants belonged to 8 different chemical classes. e, Response of glomeruli from one mosquito to the final 14 reference odorants. Note that we delivered reference odorants at high concentration (neat, 10−1, or 10−2 v/v dilutions) in order to activate as many glomeruli as possible. f, Evaluation of automated glomerulus matching. Glomeruli from 6 brains were matched as in (c). We then asked whether the matched glomeruli showed correlated responses to a new set of 13 test odorants. The plot shows the observed distribution of correlation coefficients across n=28 sets of matched glomeruli (green) and 20 shuffled distributions where matches were reassigned at random (brown). Low correlations may be caused by mismatches or general lack of response by a given set of matched glomeruli to the test odorants. g, Same as (f) except showing the mean of the observed distribution (green line) and the distribution of means from 2000 shuffled datasets. h–l, Reanalyses of data presented in Fig. 3h–k relying in part or in whole on the automated pipeline. h, Human and animal odours were cleanly separated along the first three axes of an across-matrix PCA of unmatched signal clusters from all mosquitoes (see Methods). Symbols denote individual mosquitoes (n=5); shades of red denote odour from different human subjects (n=8). i–l, Human and animal odours were also cleanly separated in an analysis of signal clusters matched by the automated algorithm (c–g). Panel (i) shows signal clusters from the segmented antennal lobe of the reference mosquito, with key glomeruli highlighted. Panel (j) shows the mean normalized response to odour extracts (top) and select reference odorants (bottom) for those signal clusters (numbered across the bottom) that could be matched in the brains of at least 3 of 5 mosquito replicates. Panels (k,l) show a principal components analysis of data from (j). Note that the limited resolution of fast, volumetric imaging causes low level bleed through of signal from one glomerulus to proximal regions of adjacent glomeruli, especially along the z (depth) axis. This can make the delineation of adjacent glomeruli during unsupervised segmentation imperfect. Some glomeruli are split into two or more initial segments (e.g. two green H segments in (i) were initially split, but later merged by the automated algorithm due to correlated reference-odorant-responses, see Methods), while others show a shadow of the response pattern of their neighbors (e.g. clusters 11 and 12 shadow B in (j) and (l)). Nevertheless, the automated analysis supports the results of the manual analysis, showing that B, H, and A dominate host odour responses and contribute to the separation of human and animal odours. A fourth glomerulus (signal cluster #9) also contributes significantly and is highlighted in purple in (i–l). This glomerulus was obscured in the manual analysis because it is just posterior to B and has partially correlated responses to vertebrate odours. However, unlike B, it is strongly activated by the reference odorant 1-octen-3-ol (j), a known ligand of palp neurons36 that project to this posterior-medial region of the antennal lobe35 (Extended Data Fig. 1h–i).
