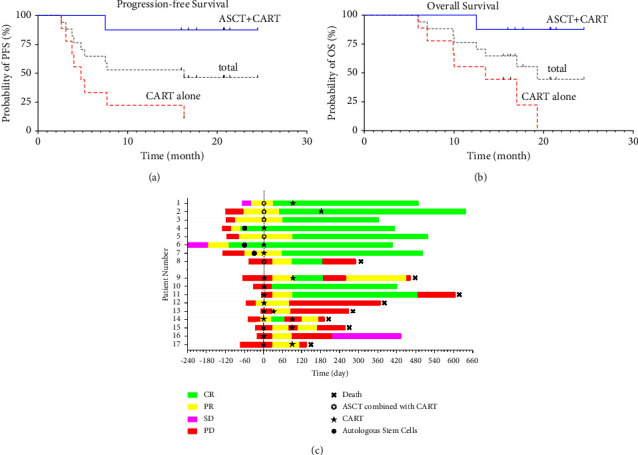
Figure 4.

Therapeutic effect of CART treatment and duration of response, progression-free survival (PFS), and overall survival (OS) estimates. (a, b) Kaplan-Meier estimates of progression-free survival and overall survival. (c) Swimmer's plot of response for all patients on study (n = 17). Different colors represent the disease status. CR, complete remission; PR, partial remission; SD, stable disease; PD, progressive disease. Day 0 shows CAR T-cells infusion. ASCT, autologous stem cell transplantation; PFS, progression-free survival; OS, overall survival.
