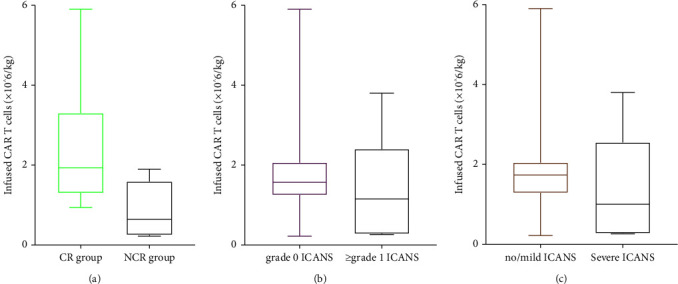
Figure 8.

(a) The correlation of dosages of CAR T-cell infusion with the occurrence of complete response (p=0.02). (b, c) The correlation of dosages of CAR T-cell infusion with the occurrence/severity of ICANS (p=0.36 and p=0.20, respectively). Horizontal lines indicate medians.
