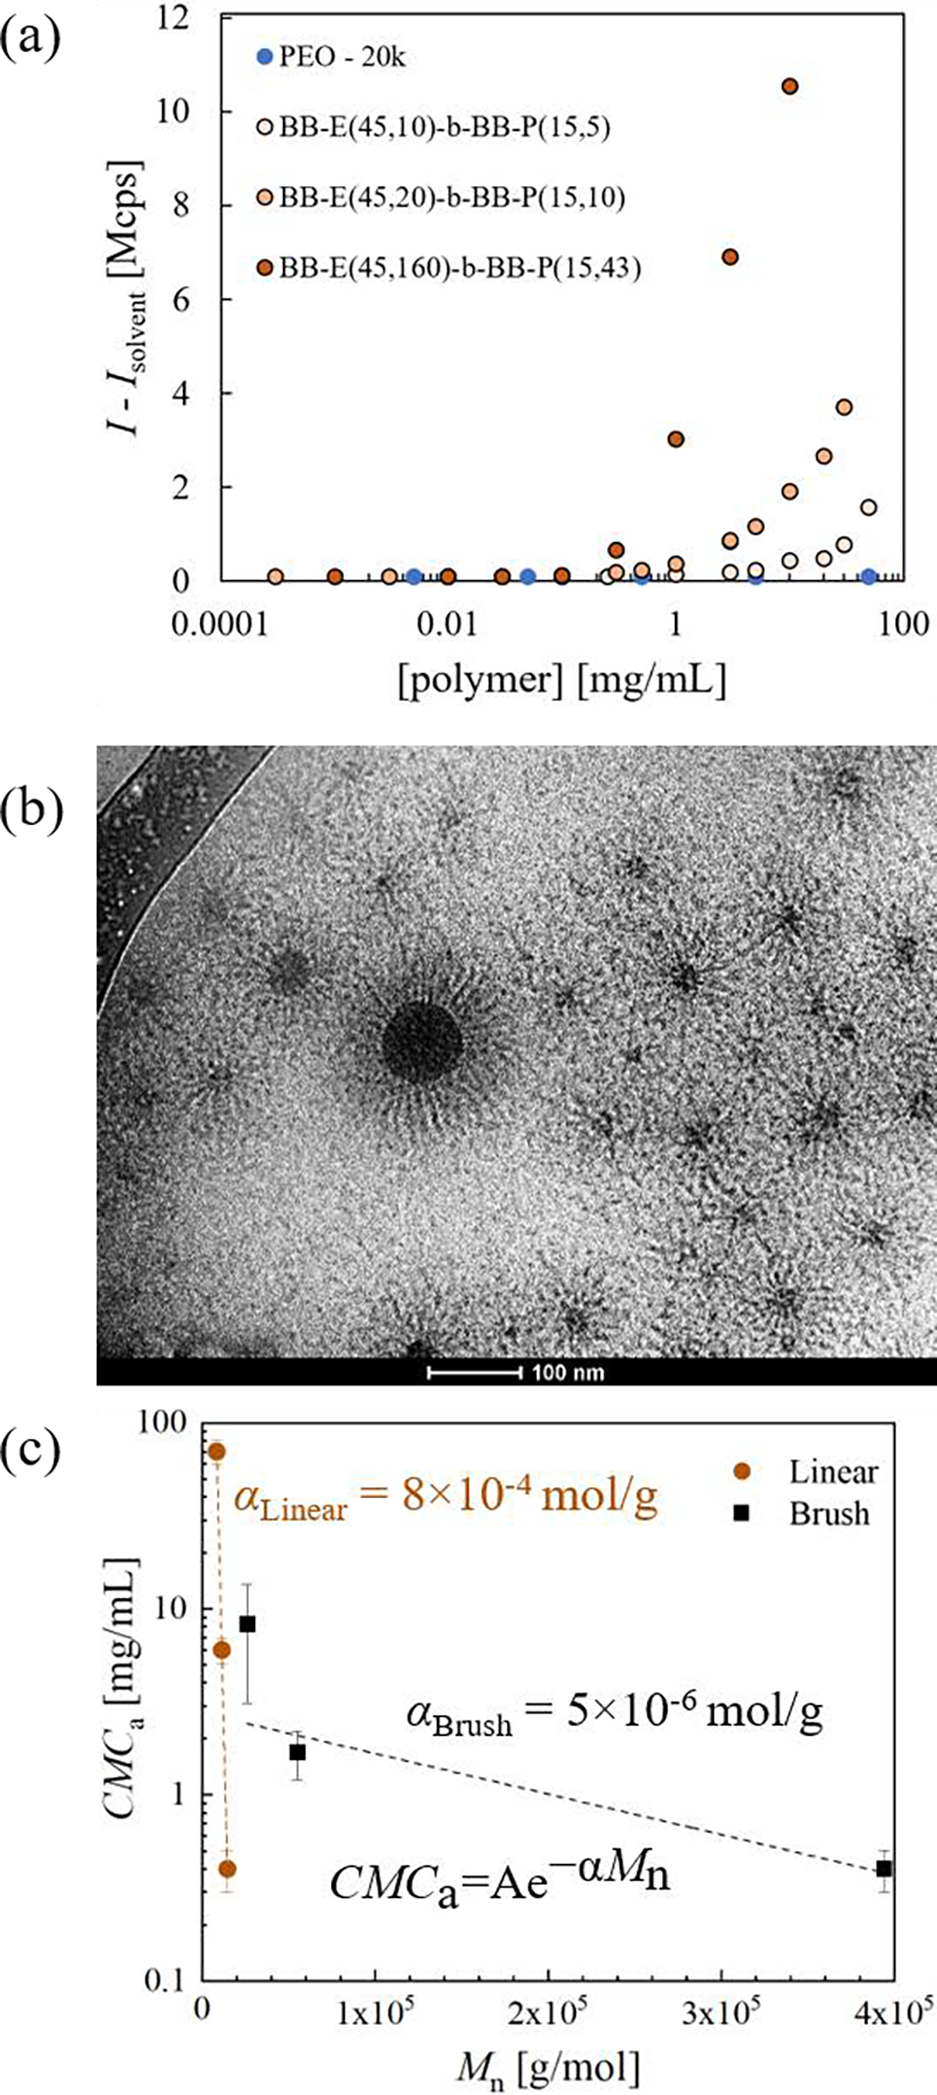
Figure 4.

(a) Excess scattering intensity at 37 °C, as a function of polymer concentration. Linear PEO with an Mn = 20 kDa is a negative control for micellization. (b) cryo-TEM micrograph of BB-E(45,160)-b-BB-P(15,43) at a concentration of 10 mg/mL in aqueous buffer with 40,000x magnification. (c) Trend between CMCa and Mn for linear and bottlebrush poloxamers of similar wt% PEO. Data for linear poloxamers (40 °C) is taken from Alexandridis et al.59 Data are fit to the exponential function shown on the graph and the correlation coefficients are 0.99 and 0.58 for linear and brush, respectively.
