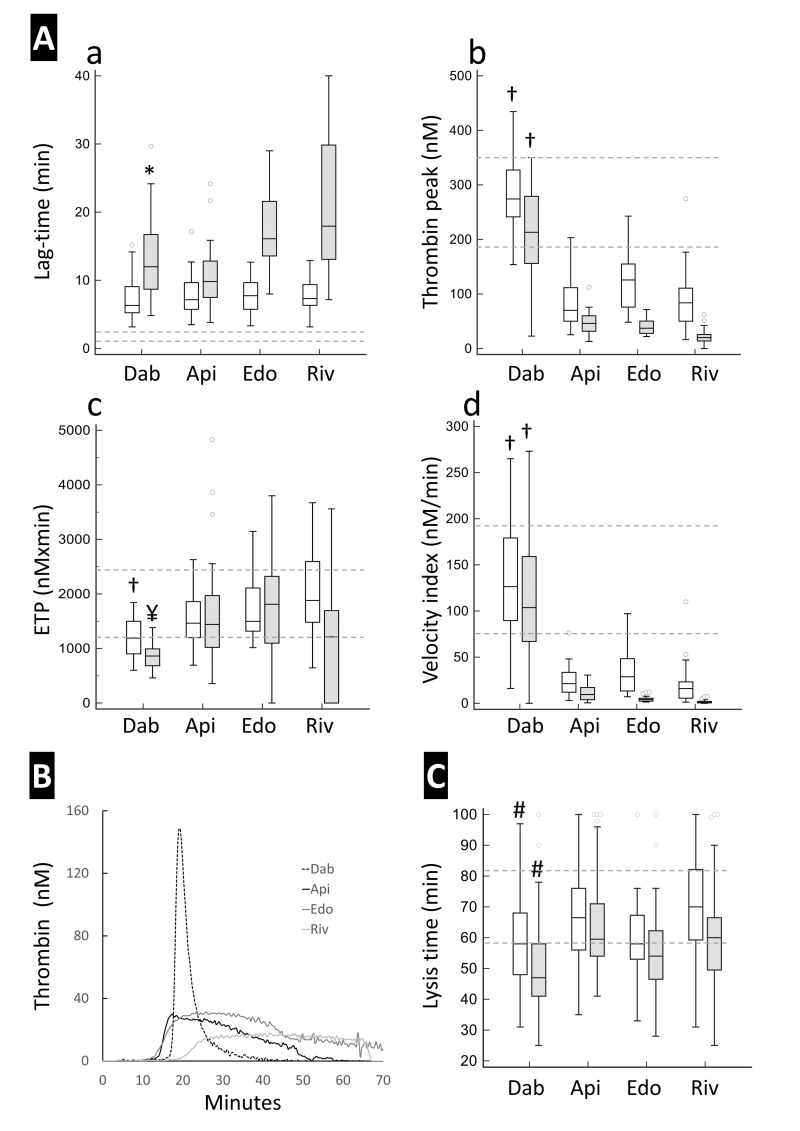
Figure 1. Thrombin generation and clot lysis of plasma samples from patients under treatment with direct oral anticoagulants.
Panel A shows the thrombin generation parameters, namely lag-time (a), thrombin peak (b), endogenous thrombin potential (c) and velocity index (d) at C-Trough (empty boxes) and C-Peak (grey boxes). Panel B illustrates representative thrombin generation curves of samples at C-Peak drug levels. Panel C reports the lysis time at C-Trough (empty boxes) and C-Peak (grey boxes) as assessed by the clot lysis turbidimetric assay. Dotted lines represent the reference values recorded in samples from healthy donors (n=26) tested in parallel. Values at C-Peak were statistically different from those at C-Trough (by Wilcoxon’s test) in all groups for all parameters except for endogenous thrombin potential in the apixaban and edoxaban groups and for lysis time in the apixaban group (not shown in the figure). †: statistically different from all Xabans; *: statistically different from edoxaban and rivaroxaban; ¥: statistically different from apixaban and edoxaban; #: statistically different from apixaban and rivaroxaban by Kruskal Wallis and post-hoc pairwise analysis according to Conover.
ETP: endogenous thrombin potential; Dab: dabigatran; Api: apixaban; Edo: edoxaban; Riv: rivaroxaban.

