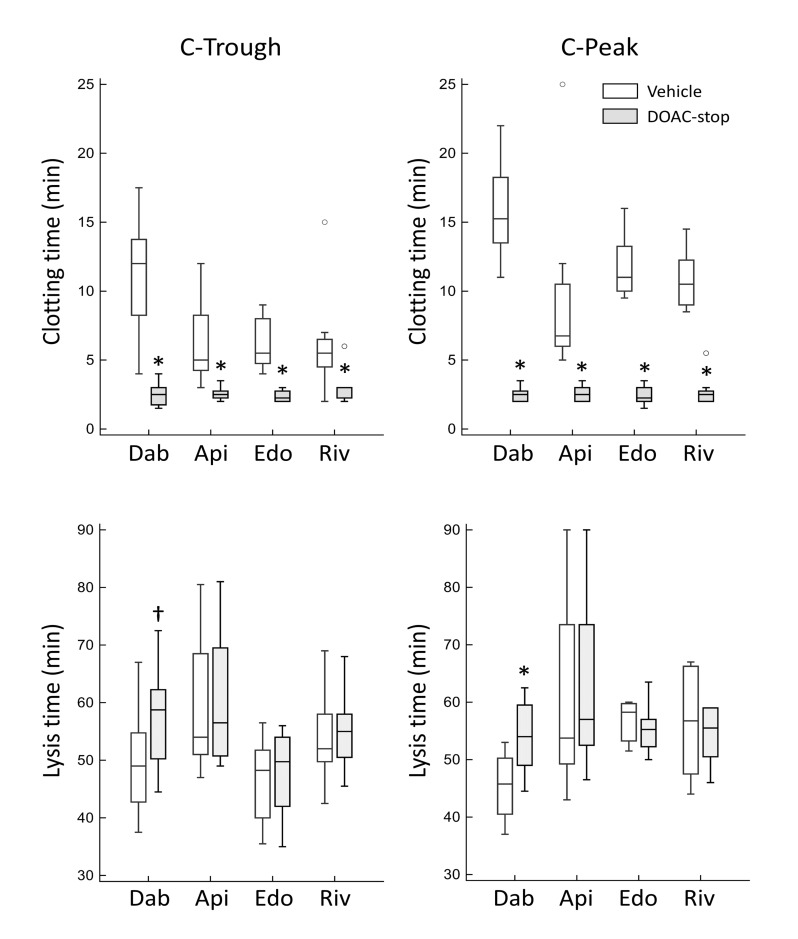
Figure 2. Effect of DOAC-stop (grey boxes) on clotting (upper panels) and lysis time (lower panels) of plasma from patients under treatment with direct oral anticoagulants.
The experiments were performed using the clot lysis turbidimetric assay, which also allows evaluation of the clotting time (i.e. the time to reach the midpoint of the clear to maximum turbidity transition). C-Trough and C-Peak samples (n=8 for both) are shown in the left and right panels, respectively. *: p=0.008; †: p=0.016 vs corresponding controls (empty boxes) by Wilcoxon’s test. Please note that, due to the limited volumes of plasma, C-Peak and C-Trough samples were obtained from different patients. Dab: dabigatran; Api: apixaban; Edo: edoxaban; Riv: rivaroxaban.

