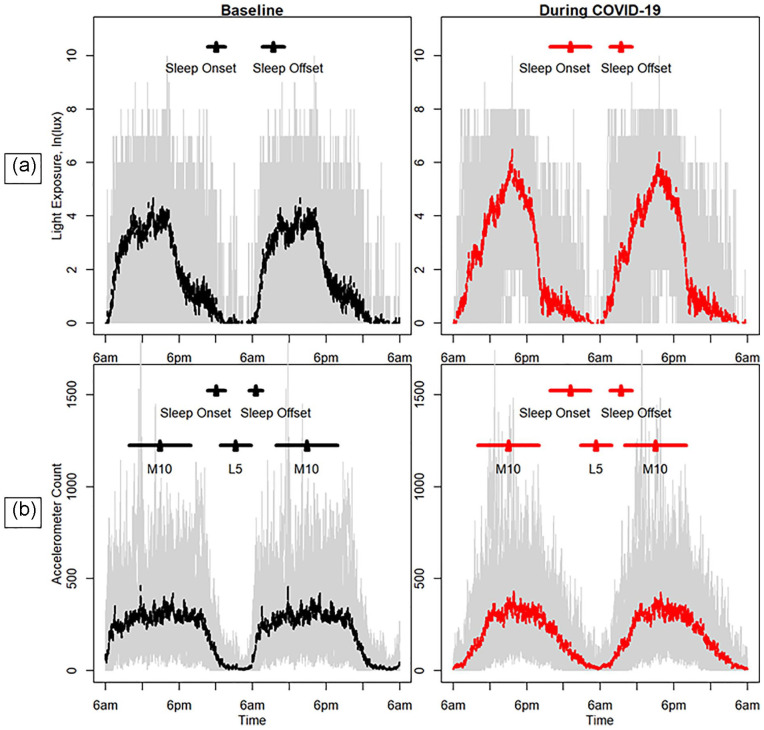
Figure 2.
Weekday light (ln lux; a) and daily accelerometer counts (b) at baseline and during the COVID-19 pandemic. The standard deviation in the average local time of sleep onset and offset are shown by the black and red horizontal bars. In addition, for accelerometry, horizontal lines are included to indicate the standard deviation in the local time of the lowest level of activity over a 5-h period (L5) and the highest level of activity over a 10-h period (M10). The gray background indicates the range (minimum and maximum) of the observed light exposures or accelerometer counts. Color version of the figure is available online.

