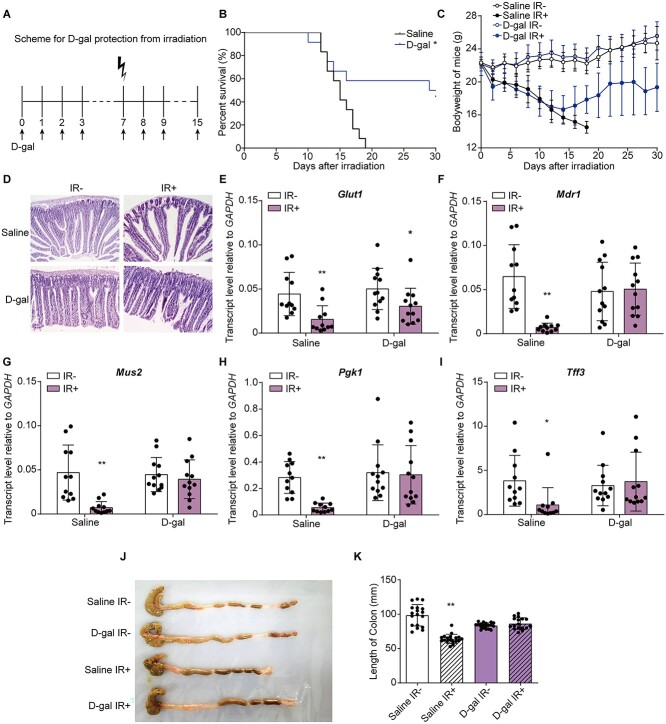
Fig. 1.
D-gal injection increased the survival rate of irradiated mice and restored the structure of the mouse small intestine. (A) Experimental outline of irradiation and D-gal administration. D-gal was injected starting 7 days before irradiation and 7 days after TBI. (B-C) Kaplan–Meier survival curve (B) and body weights (C) of mice in the saline- and D-gal-treated groups after 7.5 Gy of TBI; There are 36 mice in each group. P = 0.0137 in (B). The significance analysis were obtained from Graphpad analysis by Log-rank (Mantel-Cox) test. (D) Representative images of =H&E-stained small intestine sections from the indicated groups. (E–I) The transcript levels of Glut1 (E), Mdr1 (F), Mus2 (G), Pgk1 (H) and Tff3 (I) in the small intestine of mice exposed to the indicated treatments. The error bars in graphs means standard deviation of indicated data. * P < 0.05, ** P < 0.01; n = 12 animals per group. Data were analyzed for differences using independent samples t-test. Stars without a horizontal line were generated by comparing the IR-group in indicated treatment. Stars with a horizontal line mean that the two groups were compared. (J) Representative imagesof colons extracted from mice exposed to the indicated treatments on Day 15 after TBI. (K) The length of colons in the indicated groups. The error bars in graphs means standard deviation of indicated data. ** P < 0.01; n = 12 mice per group. Data were analyzed for differences using independent samples t-test. Stars without a horizontal line were generated by comparing the ‘Saline IR-’ group.

