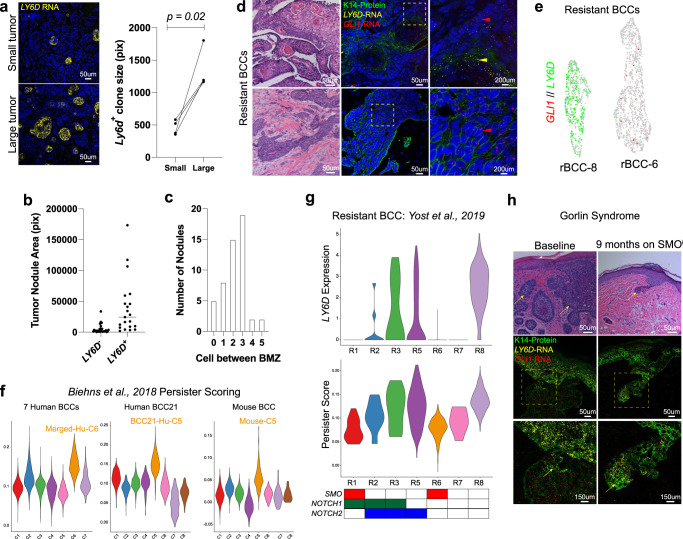
Fig. 4. Physical features and genetics influence SMOi Resistant LY6D+ cellular accumulation.
a RNAScope and quantification of Ly6d+ (yellow) clone size from small or large tumors from the same mouse. Each point represents the average clone size from small and large tumors from the same primary mouse (n = 4). Lines between dots indicate the small and large tumors from the same primary tumor. b Tumor nodule areas from human BCC21 that are either LY6D+ or LY6D− from Fig. 1l. The median area is indicated. c The number of cells between basosquamous regions and the BMZ from human BCC21 in Fig. 1l. d H/E and corresponding RNAScope of the spatial localization of LY6D (yellow) and GLI1 (red) in resistant human BCCs, which is co-stained for K14 protein (green). The upper tumor displays an example of an rBCC with basosquamous/SCC-like features, while the lower tumor does not. Zoomed-in regions are indicated with yellow dashed boxes. Regions enriched for LY6D are indicated with a yellow arrow. Regions enriched for GLI1 are indicated with a red arrow. n = 2. e Feature plot of two resistant human BCCs showing dual expression of GLI1 and LY6D. R8 (left) has basosquamous markers, where R6 (right) does not. f Persister score (from Biehns et al., 2018) for the various BCC datasets with the Merged-Hu-C6 (left), BCC21-Hu-C5 (center), and Mouse-C5 (right) all indicated. g Violin plot for LY6D expression (top), Persister scoring (middle), and mutational status (bottom) for various resistant human BCCs (from Yost et al., 2019). h H/E examples of baseline (left) and SMOi (right) treated tumors from Gorlin patients. Below is RNAScope indicating the spatial localization of LY6D (yellow) and GLI1 (red), which is co-stained with K14 protein (green) in baseline (left) and on SMOi (right) Gorlin patients. The SMOi (right) treated RNAScope image is matched with the H/E above. Zoomed-in regions are indicated with yellow dashed boxes. Yellow arrows point to regions enriched for LY6D. n = 1. Length of each scale bar is noted in figure. a p values were calculated using unpaired, two-tailed t test. Source data are provided as a Source Data file.

