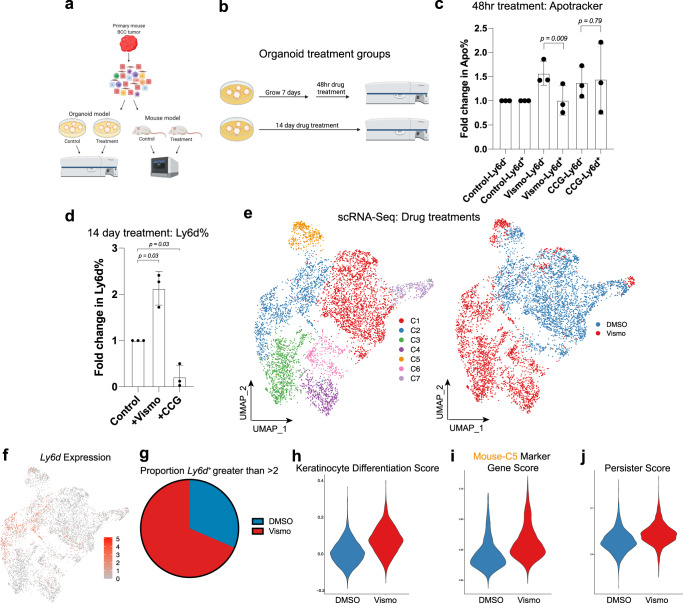
Fig. 5. Drug treatments influence LY6D+ cellular accumulation.
a Schematic diagram for tumor dissociation and subsequent experimental designs with in vitro organoid or in vivo allograft drug treatments. b Schematic diagram of organoid treatments designed to examine acute and long-term drug treatments. c Fold change in Apotracker Green in organoids treated with either SMOi or CCG. Each point represents Apotracker Green% of Ly6d− or Ly6d+ cells from distinct drug treated organoids derived from different primary tumors (n = 3). d Fold change in Ly6d% in organoids treated with either SMOi or CCG. Each point represents the fold change in Ly6d% from distinct drug treated organoids derived from different primary tumors (n = 3). e UMAP plot of merged scRNA-Seq data from control and SMOi-treated mouse tumors by clusters (left) and treatment groups (right). f Feature plot for Ly6d expression data for Fig. 5c. g The proportion of cells from control or SMOi treated tumors with a Ly6d expression level >2. h Keratinocyte Differentiation Score for the control or SMOi treated tumors in Fig. 5c. i Mouse-C5 marker gene score from the mouse scRNA-Seq data for the control or SMOi treated tumors in Fig. 5c. j Persister score for the control or SMOi treated tumors in Fig. 5c. c, d Error bars represent mean +/−SD. c, d p values were calculated using unpaired, two-tailed t test. Source data are provided as a Source Data file.

