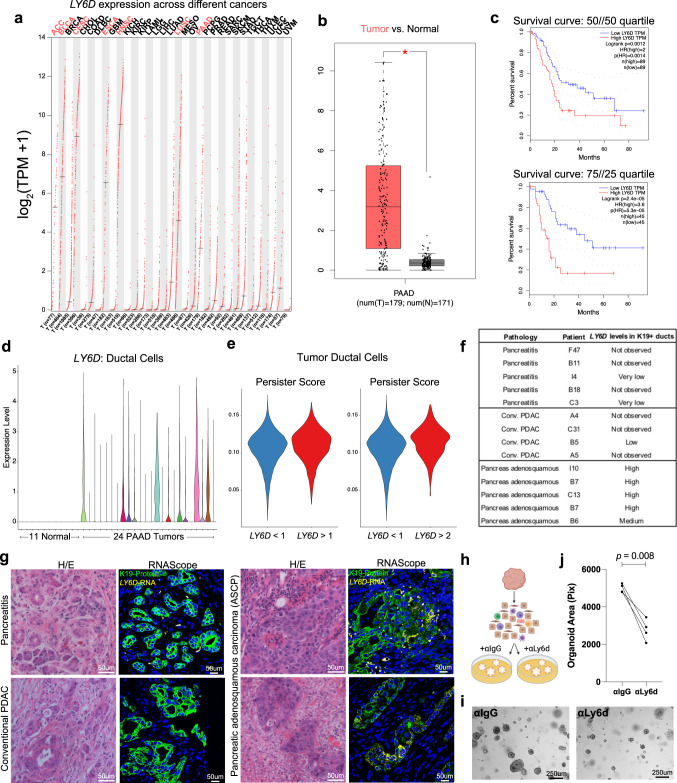
Fig. 6. LY6D+ populations in epithelial tumors exhibit poor outcomes.
a Bulk gene expression profile of LY6D across different cancer types. Cancers with log2(TPM + 1) greater than 2 are highlighted in red. b Bulk gene expression profile of LY6D between PAAD tumor and normal pancreatic tissue. 179 tumors and 171 normal samples shown. Box and whisker boundaries indicate the 25th and 75th percentile, limits indicate minima and maxima values, and center value indicating the mean. c Survival curves between patients with high and low levels of LY6D with two different quartile cutoffs. 50//50 quartile: 89 patients in high and low LY6D groups; 75//25 quartile: 45 patients in high and low LY6D groups. d Violin plot showing scRNA-Seq expression of LY6D across ductal cells from 11 control pancreas samples and 24 different tumors. e Persister score for tumor ductal cells that have greater than or less than a specified LY6D expression level. f Summary table of LY6D expression levels across multiple tumor samples. g H/E and corresponding RNAScope for LY6D (yellow) and co-stained with K19-protein (green) for human pancreatitis, conventional pancreatic adenocarcinoma (PDAC), and pancreatic adenosquamous carcinoma. n = 5 pancreatitis, n = 4 PDAC, and n = 5 pancreatic adenosquamous carcinoma samples. h Schematic diagram for mouse BCC tumor dissociation and subsequent organoid culture with and without anti-Ly6d. i Brightfield images of mouse BCC tumor organoids treated with anti-IgG control or anti-Ly6d. j Quantification of the number of organoids from BCC tumors treated with anti-IgG or anti-Ly6d. Each point represents the number of organoids from distinct primary tumors (n = 4). Length of each scale bar is noted in figure. j p values were calculated using unpaired, two-tailed t test. b p values were calculated using a one-way ANOVA with the ‘*’ indicating a p < 0.01. Source data are provided as a Source Data file.

