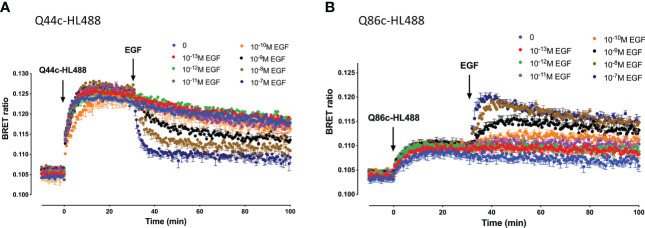
Figure 6.
Kinetics of EGF-induced changes in the NanoBRET signal obtained with fluorescent (A) Q44c-HL488 or (B) Q86c-HL488 binding to NLuc-EGFR. HEK293 cells stably expressing full-length N-terminal nanoluciferase-EGFR were treated with furimazine (12.5 nM) and, luminescence and fluorescence values were read for 15 minutes (every 60 sec) at 37oC using a BMG Pherastar. Following this period, cells were treated with 25 nM of either respective fluorescent nanobody and luminescence and fluorescence emissions simultaneously recorded for a further 30 min at 37oC. After 30 minutes, various concentrations of EGF were added to the wells and measurements continued for a further 30 minutes at 37oC. Data are mean ± SEM from triplicate determinations in a single experiment. This single experiment is representative of five independent experiments performed.

