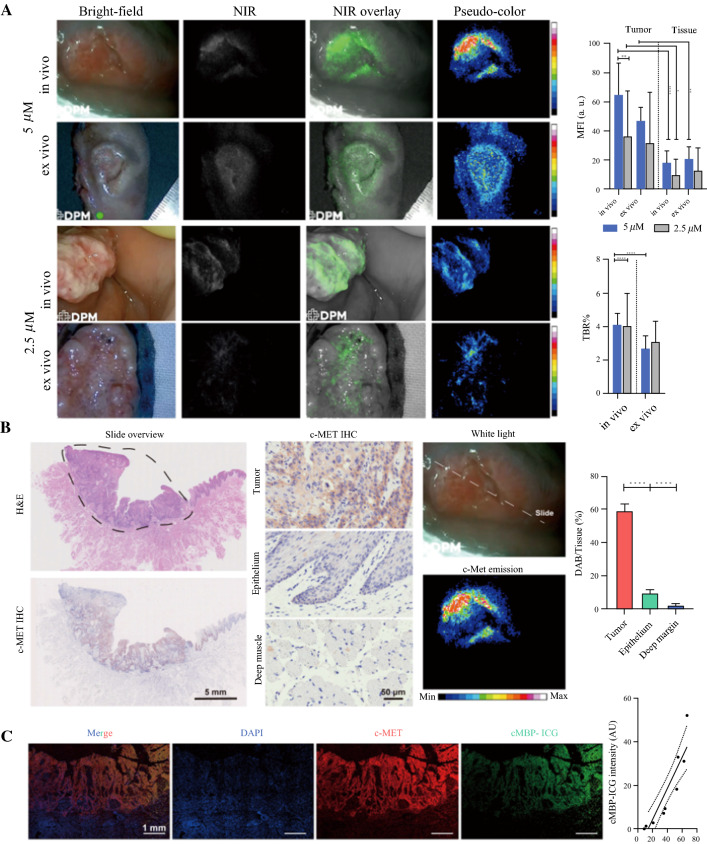
Fig. 2.
Analysis of cMBP-ICG dosage selection in vivo and ex vivo after fluorescence imaging, and correlation between c-MET expression and cMBP-ICG signal intensity. A Snapshots of two patients from different dosage groups. The MFI and TBR of each group and each application procedure (in vivo/ex vivo) were calculated following the same process. *p < 0.05, **p < 0.01, ***p < 0.001, ****p < 0.0001. Data are presented as mean ± SEM. B Representative c-MET immunohistochemistry images and hematoxylin and eosin images from a paraffin-embedded tumor section of a patient (slide overview) showing an area of head and neck squamous cell carcinoma (SCC) (black circle). Preoperative in vivo cMBP-ICG imaging of the patient showing the slide location in the whole tumor. C Immunofluorescence of the paraffin-embedded tumor shown in panel B. cMBP-ICG, c-MET-binding peptide-indocyanine green; MFI, mean fluorescence intensity; TBR, tumor-to-background ratio; SEM, standard error of the mean

