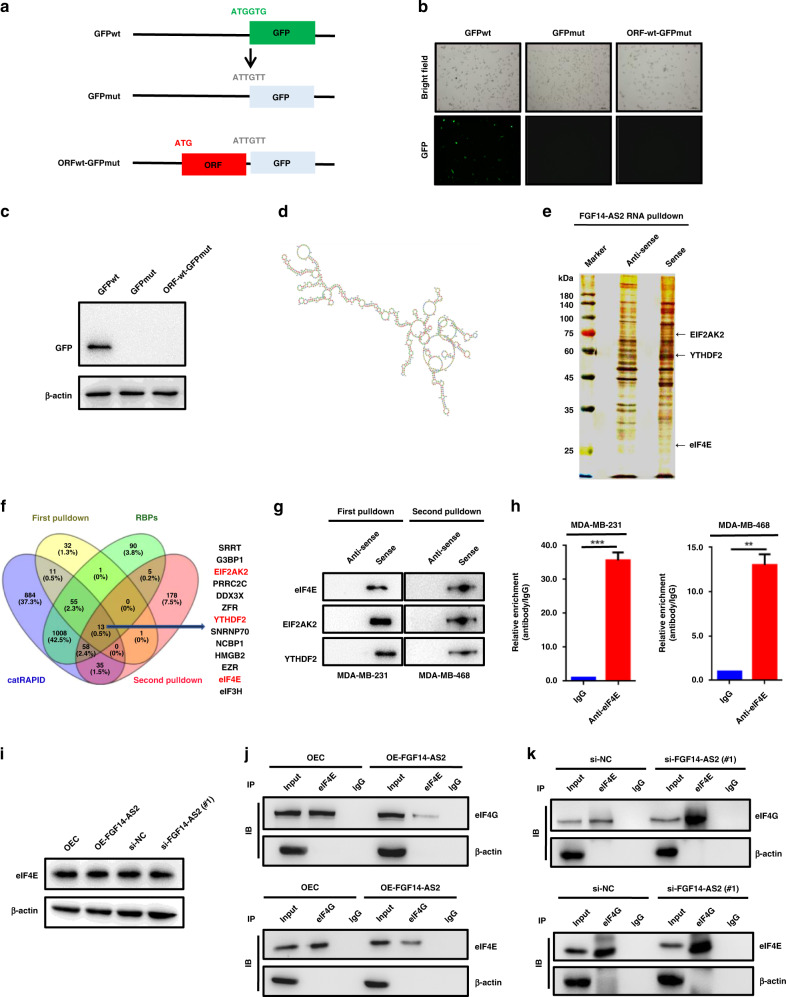
Fig. 4. FGF14-AS2 interferes with eIF4E/eIF4G complex formation.
a Schematic diagram of GFP constructs (GFPwt, GFPmut and ORFwt-GFPmut). b, c Expression of GFP was detected using fluorescence microscopy (b) and western blotting (c). d Secondary structure of FGF14-AS2 predicted by omicX (https://omictools.com/rnastructure-tool). e MDA-MB-231 cell lysates were incubated with biotin-labelled oligonucleotides, and the pull-down proteins were subjected to SDS-PAGE followed by silver staining. The lanes were extracted by cutting and then subjected to LC-MS analysis. f Venn diagram shows the 13 proteins potentially binding to FGF14-AS2 based on LC-MS data (two independent RNA pull-down assays), website predictions and classic RNA-binding protein dataset. g RNA pulldown followed by western blotting was performed with the indicated cell lysates and anti-eIF4E, anti-EIF2AK2 or anti-YTHDF2 antibodies. h RIP assay was performed using the indicated cell lysates and anti-eIF4E antibodies. The coprecipitated RNAs were subjected to qRT-PCR to detect FGF14-AS2. The fold enrichment of FGF14-AS2 in the eIF4E pellet is shown relative to its matching IgG control. i eIF4E levels in FGF14-AS2-overexpressing or FGF14-AS2-knockdown cells were detected using western blotting. j, k Co-IP assays were performed to detect the interaction between eIF4E and eIF4G in FGF14-AS2-overexpressing (j) and FGF14-AS2 knockdown cells (k). The data are shown as the mean ± s.d. of at least three independent experiments. ***P < 0.001.

