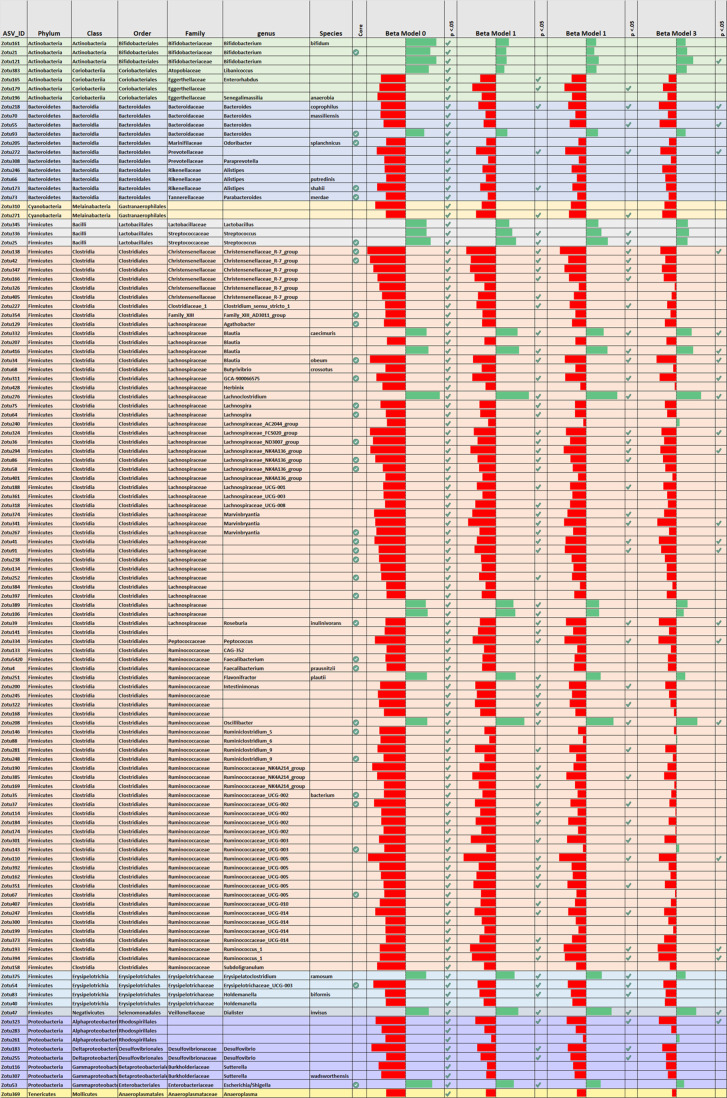
Fig. 2. Selection of ASVs (rows) that were significantly associated with depressive symptom levels in unadjusted analyses (Model 0) and results of subsequent adjusted analyses (Models 1–3).
Bars indicate effect size (standardized regression coefficient). Green bars indicating a positive and Red bars indicating a negative association (plotted range 0.10 ≥ β ≥ –0.10). Checkmark indicate p < 0.05. The column “Core” highlights ASVs with >75% overall prevalence in the sample population (indicated by green check mark).

