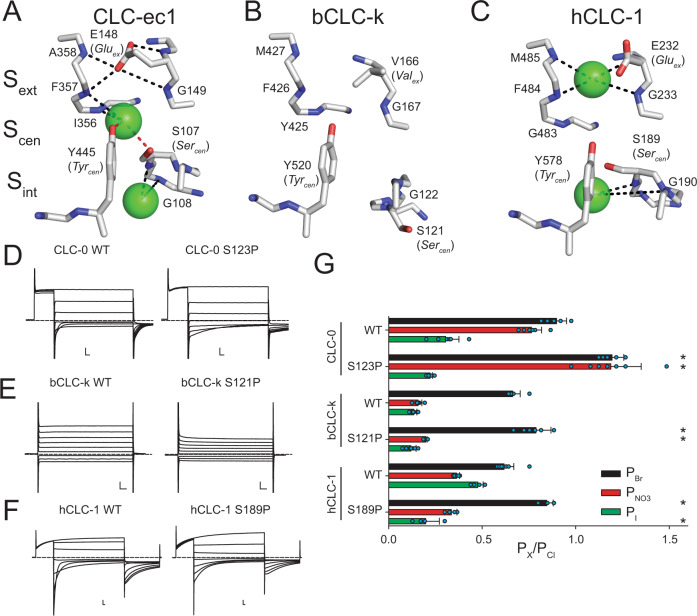
Fig. 1. Structural architecture and ion coordination in the Cl− pathway of CLC channels and transporters.
Close up view of the Cl− permeation pathway in CLC-ec1 (PDB: 1OTS, A), bCLC-k (PBD: 5TQQ, B) and CLC-1 (PDB: 6COY, C). The position of the external (Sext), central (Scen) and internal (Sint) binding sites is identified based on the crystal structure of CLC-ec131. Bound Cl− ions are shown as green spheres. No ions were resolved in the bCLC-k structure33. Dashed lines indicate hydrogen bonds between the Cl− ions and side chains (red) or backbone amides (black)31,34. Representative current traces of WT and proline mutants at Sercen in CLC-0 (D), bCLC-k (E) and hCLC-1 (F). Dashed lines indicate the 0 current level. Scale bars indicate 2 µA and 10 ms. G The relative permeability ratios for Br−, NO3− and I− of CLC-0 (WT and S123P), bCLC-k (WT and S121P) and hCLC-1 (WT and S189P). Data are Mean ± St.Dev. of n > 4 repeats from N ≥ 3 independent oocyte batches, individual data points are shown as cyan circles. The statistical significance of the effects of the mutants on the permeability ratios of each ion (indicated by *) was evaluated with a one-sided Student’s t-test with a Bonferroni correction (see Methods). Mean values and p-values are reported in Supplementary Table 1. Individual data points are shown grouped by ion in Supplementary Fig. 5. Raw data for D–G and Fig. 2B, C is included in the Source Data Files.

