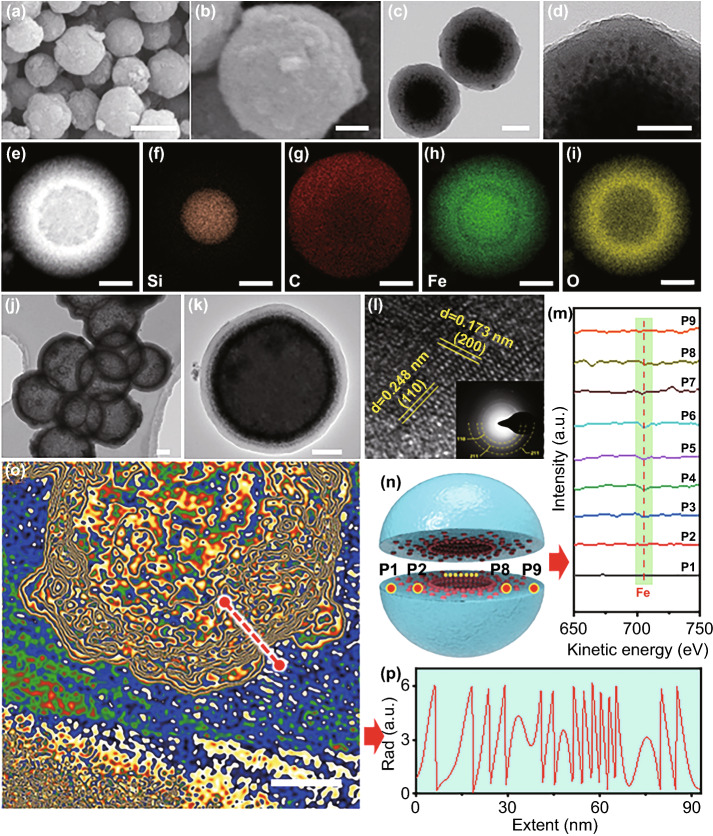
Fig. 2.
Morphologies and dispersion measurement of the grade-distributed Fe3O4/C nanospheres precursor and air@G-Fe/C nanospheres of T210. a, b SEM and c, d TEM images of the graded distributed Fe3O4@C nanospheres precursor. e STEM and f-i the corresponding EDS mapping images of Si, C, Fe, and O elements dispersion in the typical nanospheres. j, k TEM images of the hollow graded distributed Fe/C nanospheres. l HRTEM images of graded distributed Fe/C nanospheres, the inset in (l) is SAED image of the hollow graded distributed Fe/C nanospheres. m Auger electron spectroscopy (AES) of Fe element and n the corresponding section schematic. o The off-axis electron holography and p corresponding charge density distribution line profiles obtained from the red line in (o). The scale bar of a is 500 nm, the scale bar of b, c, and d is 100 nm, the scale bar of e-i is 200 nm, the scale bar of j, k, and o is 100 nm

