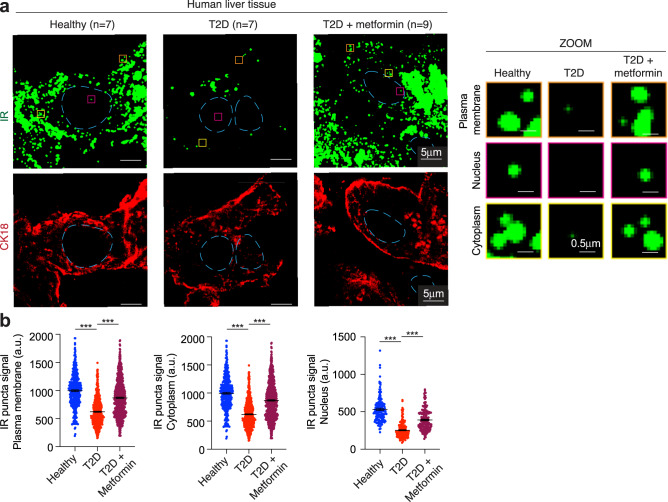
Fig. 1. Insulin receptor bodies in human liver cells.
a Representative immunofluorescence images for IR and CK18 in liver tissue from a healthy donor (Healthy), a donor with T2D (T2D), and a donor with T2D who had been treated with metformin (T2D + metformin). Dashed light blue lines represent the nuclear outline. Orange, magenta, and yellow boxes represent regions at the plasma membrane, nucleus, and cytoplasm, respectively, that are magnified on the right (ZOOM). Scale bars are indicated in the images. b Quantification of IR signal in puncta at the plasma membrane, cytoplasm, and nucleus for seven healthy donors (blue), seven donors with T2D (red), and nine donors with T2D who had been treated with metformin (purple). Data are represented as mean + /− standard error of the mean (SEM). The number of puncta analyzed: healthy plasma membrane 399 puncta, cytoplasm 304 puncta, nucleus 137 puncta; T2D plasma membrane 618 puncta, cytoplasm 283 puncta, nucleus 187 puncta; T2D metformin plasma membrane 716 puncta, cytoplasm 350 puncta, nucleus 173 puncta. Unpaired two-sided t test was used for statistical analysis.

