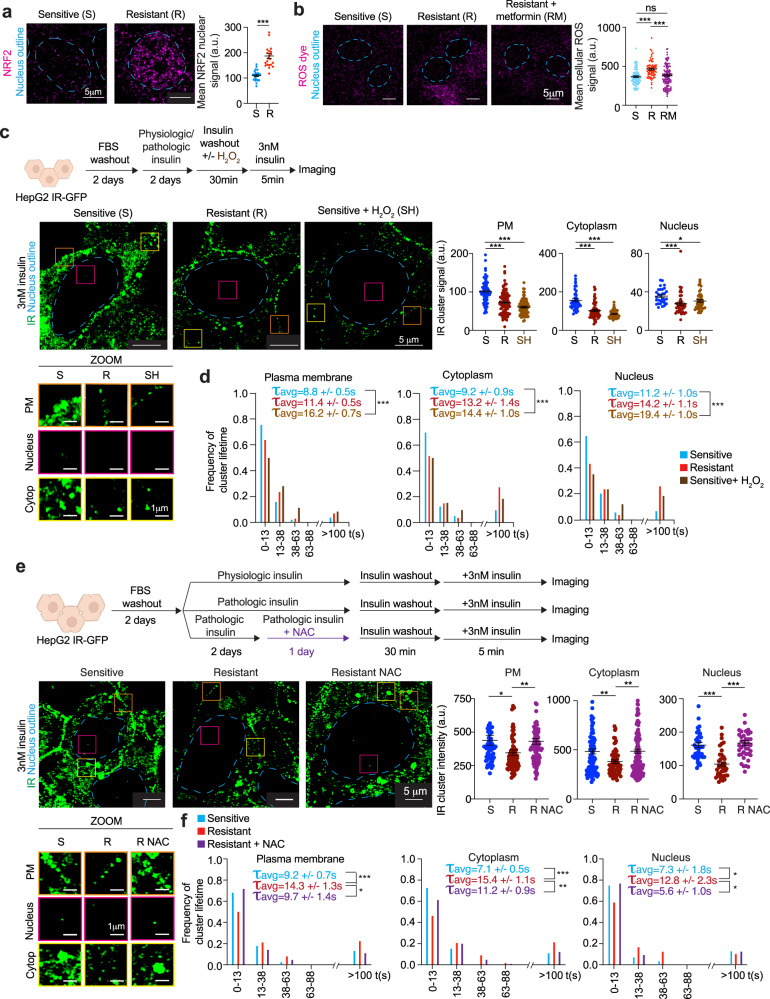
Fig. 5. High ROS levels promote IR cluster dysregulation.
a Representative immunofluorescence images for NRF2 (magenta) in insulin-sensitive or resistant cells (left). Dashed light blue lines represent the nuclear outline. Quantification of mean NRF2 signal intensity in nuclei of insulin-sensitive (sensitive, S) or resistant (resistant, R) cells (right). Data are represented as mean + /− SEM. The number of cells analyzed: insulin-sensitive 27 cells and insulin-resistant 22 cells. Unpaired two-sided t test was used for statistical analysis. b Representative images of cells treated with ROS-sensitive dye (left). Dashed light blue lines represent the nuclear outline. Quantification of mean ROS signal in insulin-sensitive (sensitive, S), insulin-resistant (resistant, R), and metformin-treated insulin-resistant cells (resistant + metformin, RM) (right). Metformin concentration used was 12.5 μM. Data are represented as mean + /− SEM. The number of cells analyzed: sensitive 107 cells, resistant 70 cells, resistant + metformin 134 cells. Unpaired two-sided t test was used for statistical analysis. c Schematic of cell treatments (top). Representative images of IR-GFP in insulin-sensitive cells (sensitive, S), insulin-resistant cells (resistant, R) or insulin-sensitive cells treated with H2O2 (sensitive + H2O2, SH) (middle left). Dashed light blue lines represent the nuclear outline. Orange, magenta, and yellow boxes represent regions at the plasma membrane (PM), nucleus, and cytoplasm (Cytop), respectively, that are magnified at the bottom (ZOOM). Scale bars are indicated. Quantification of IR-GFP signal intensity in IR clusters at the plasma membrane (PM), cytoplasm, and nucleus in insulin-sensitive (S), insulin-resistant (R), and H2O2-treated insulin-sensitive (SH) cells (right). Data are represented as mean + /− SEM. The number of clusters analyzed: sensitive plasma membrane 68 clusters, cytoplasm 40 clusters, nucleus 30 clusters; resistant plasma membrane 96 clusters, cytoplasm 60 clusters, nucleus 37 clusters; sensitive + H2O2 plasma membrane 79 clusters, cytoplasm 45 clusters, nucleus 44 clusters. Unpaired t test was used for statistical analysis. d Frequency of IR cluster lifetime in insulin-sensitive (sensitive, light blue), insulin-resistant (resistant, red), and H2O2-treated insulin-sensitive (sensitive + H2O2, brown) cells. The average lifetime (τavg) of short-lived IR clusters + /− SEM is reported. The number of short-lived clusters analyzed: sensitive plasma membrane 432 clusters, cytoplasm 247 clusters, nucleus 181 clusters; resistant plasma membrane 547 clusters, cytoplasm 154 clusters, nucleus 222 clusters; sensitive + H2O2 plasma membrane 564 clusters, cytoplasm 379 clusters, nucleus 314 clusters. Unpaired two-sided t test was used for statistical analysis. e Schematic of cell treatments (top). Representative images of IR-GFP in insulin-sensitive cells (S, sensitive), insulin-resistant cells (R, resistant), or insulin-resistant cells treated with NAC (R NAC, resistant NAC) (middle left). Dashed light blue lines represent the nuclear outline. Orange, magenta, and yellow boxes represent regions at the plasma membrane (PM), nucleus, and cytoplasm (Cytop), respectively, that are magnified at the bottom (ZOOM). Scale bars are indicated. Quantification of IR-GFP signal intensity in IR clusters in insulin-sensitive (S), resistant (R), and NAC-treated insulin-resistant (R NAC) cells (middle right). Data are represented as mean + /- SEM. The number of IR clusters analyzed: sensitive plasma membrane 66 clusters, cytoplasm 109 clusters, nucleus 40 clusters; resistant plasma membrane 74 clusters, cytoplasm 73 clusters, nucleus 40 clusters; resistant NAC plasma membrane 91 clusters, cytoplasm 183 clusters, nucleus 41 clusters. Unpaired two-sided t test was used for statistical analysis. f Frequency of IR cluster lifetime in insulin-sensitive (sensitive, light blue), insulin-resistant (resistant, red), and NAC-treated insulin-resistant (resistant + NAC, purple) cells. The average lifetime (τavg) of short-lived IR clusters + /− SEM is reported in the graphs. The number of short-lived clusters analyzed: sensitive plasma membrane 143 clusters, cytoplasm 168 clusters, nucleus 53 clusters; resistant plasma membrane 159 clusters, cytoplasm 309 clusters, nucleus 47 clusters; resistant + NAC plasma membrane 94 clusters, cytoplasm 232 clusters, nucleus 31 clusters. Unpaired two-sided t test was used for statistical analysis for all comparisons, except for nucleus sensitive vs resistant for which unpaired one-sided t test was used for statistical analysis. Source data are provided as a Source Data file.

