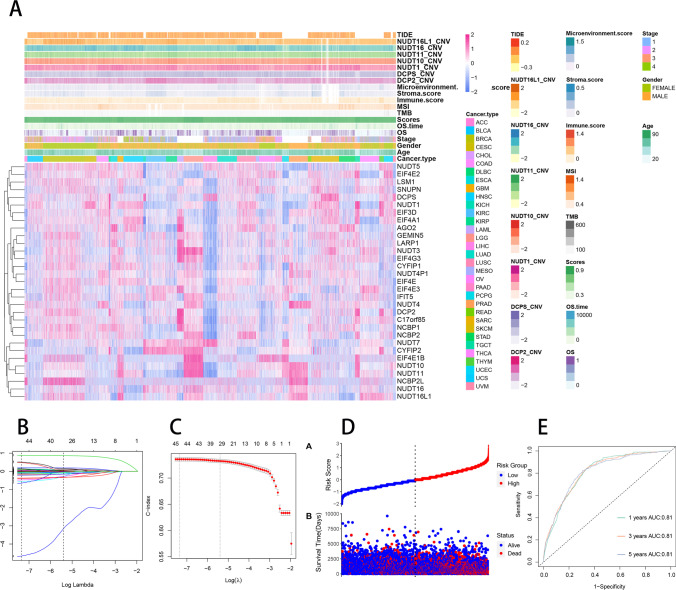
Fig. 16.
Construction of m7G prognostic model. A Correlation of m7RGs with m7G scores, tumor type, tumor stage, gender, age, overall survival, TMB, MSI, immune microenvironment score, CNV and TIDE score. B Selection of tuning parameter (λ) in the LASSO regression using tenfold-cross-validation via minimum criteria. The C-index is plotted versus log (λ). At the optimal values log(λ), where features are selected, dotted vertical lines are set by using the minimum criteria and the 1 standard error of the minimum criteria. C LASSO coefficient profiles for features, each coefficient profile plot is produced versus log (λ) sequence. Dotted vertical line is set at the non-zero coefficients selected via tenfold cross-validation. D The relationship between risk scores and the survival status and survival time. E ROC curves for prognostic models predicting survival at 1, 3, and 5 years

