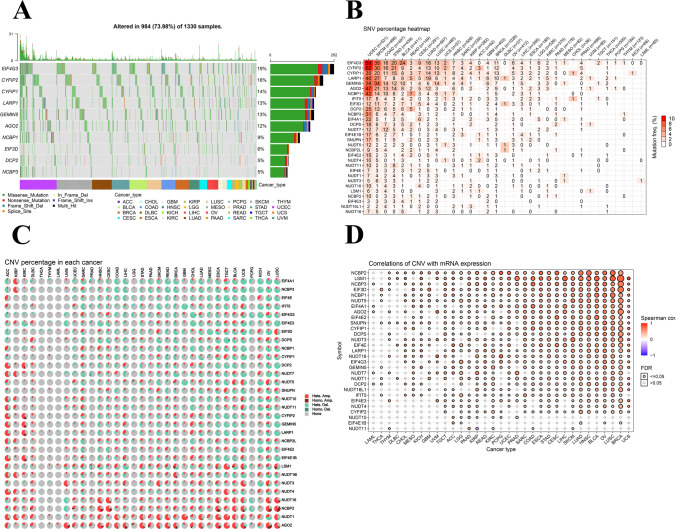
Fig. 3.
CNV and SNP of m7G regulator genes. A SNV oncoplot. The cancer map shows the distribution of m7G mutations and the classification of SNV types (e.g., missense mutations, frame-shift loss, and nonsense mutations). Selected cancer samples are displayed together with a side and top bars showing the number of variations in each sample or gene. B The SNV frequency of genes in cancers. The darker the color, the higher the mutation frequency. Numbers represent the percentage of samples that have the corresponding mutated gene for a given cancer. 0 indicates that there was no mutation in the gene coding region, and no number indicates that there was no mutation in any region of the gene. C CNV pie charts in 33 cancers. The combined heterozygous or homozygous CNVs for each gene in different cancer types are shown in the CNV pie chart. D CNV correlation with mRNA expression. The association between paired mRNA expression and CNV percentage in samples was based on a Pearson product-moment correlation coefficient. The size of the point represents the statistical significance, the bigger the dot size, the higher the statistical significance

