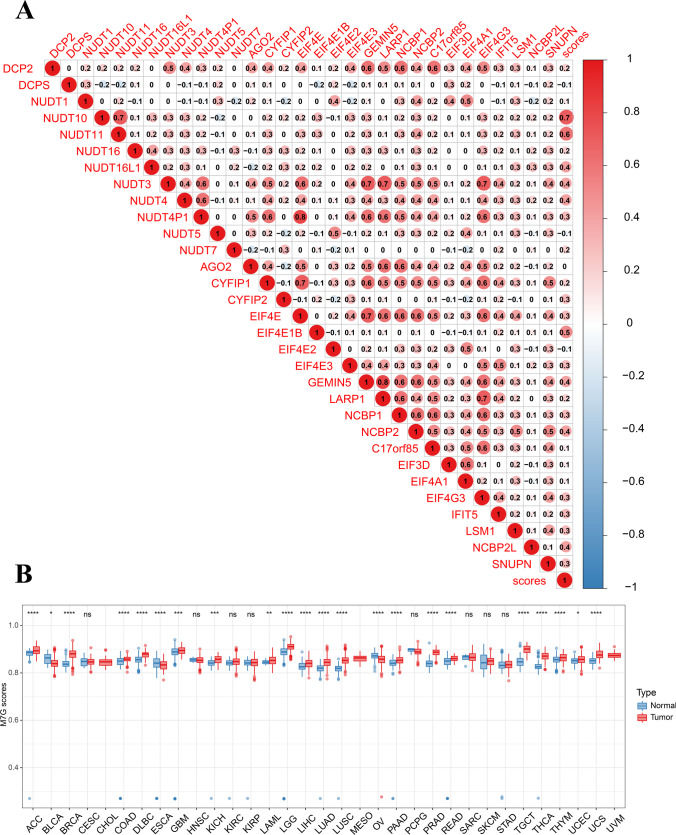
Fig. 6.
Differential expression of m7G score and the correlation with staging. A Correlation between m7RGs and m7G score. Red is positive, blue is negative, and the darker the color, the stronger the correlation. B m7G score was analyzed by combining GTEX and TCGA databases. The box line represents the average value. The box line of the red box block is higher than that of the blue box block, indicating a positive correlation and vice versa

