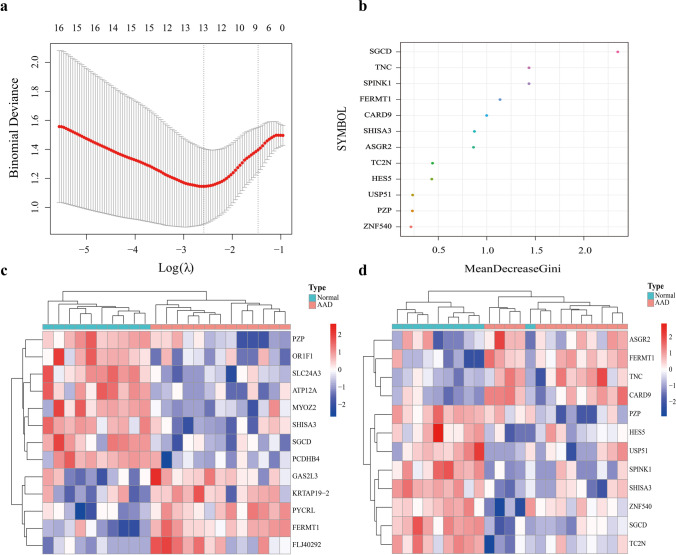
Fig. 3.
Key markers screened and heatmap. a Thirteen key markers were screened out using the Lasso regression model. b Results of 12 key markers screening using the random forest classifier Gini coefficient algorithm. c–d Sample clustering heatmap. Samples were clustered by the key markers screened from the two models. Red and blue indicate genes with high and low expression in the samples, respectively. Green and red bands on the upper edge of the heat map indicate healthy and AAD samples respectively

