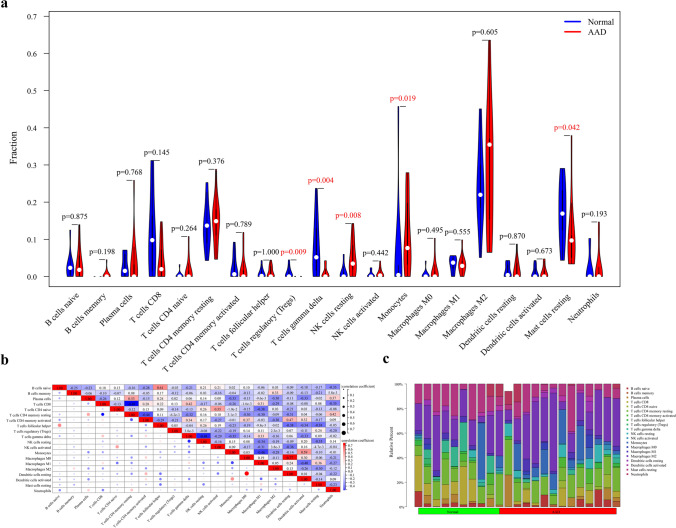
Fig. 6.
Analysis of the immune infiltrating cells between AAD and healthy human tissues. a Violin plot showing the differentiation of the ratio of the 20 immune cell types between AAD samples and healthy human samples using the Wilcoxon rank-sum test. b Correlation analysis between each immune cell type. c Bar graph showing the ratio of the 20 immune cell types in the AAD samples in the training set, with each column representing one sample

