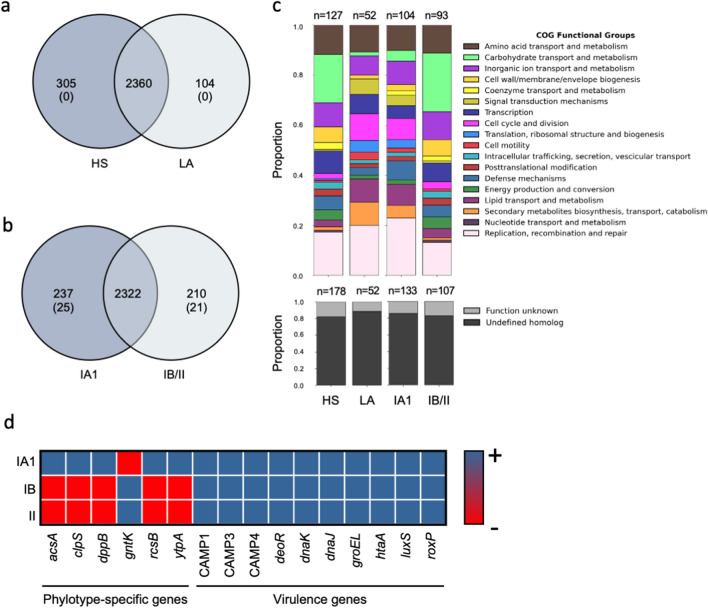
Figure 3.
Shared and unique genes in 20 C. acnes strains. Venn diagrams display the distribution of shared and unique genes between (a) C. acnes strains from healthy subjects (HS) and the lesional area of acne patients (LA) and (b) phylotypes IA1 and IB/II. Overlapping regions show the genes conserved within strains. The number between brackets represents the unique genes present in all the strains of a particular group. (c) The stacked bar chart of Cluster of Orthologous Genes (COGs) functional category proportions is based on the unique genes in all groups. The n above each group indicates the absolute count of COGs identified in each group. (d) Similarity matrix categories represent the presence (blue; +) or the absence (red, -) of C. acnes virulence genes and phylotype-specific genes.

