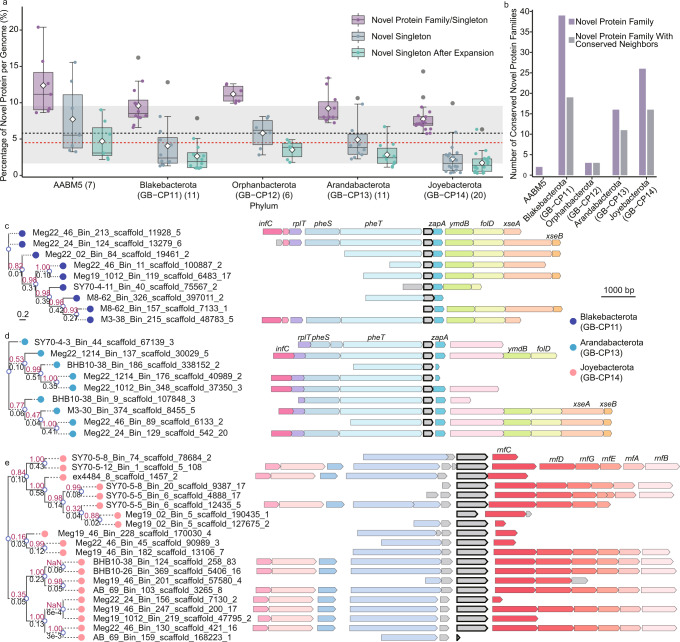
Fig. 2. Novel protein families in the five newly described phyla.
a Box plot showing the percentage of novel proteins in the proteomes of the five newly described phyla. The number of genomes within each phylum recovered in this study are shown in parentheses (n = 7, 11, 6, 11, and 20 for AABM5, Blakebacterota, Orphanbacterota, Arandabacterota, and Joyebacterota, respectively). The box plot shows the first and third quartiles (top and bottom of the box), median (horizontal line inside the box), mean (diamond inside the box), lower and upper extremes (whiskers), outliers (dark gray dots), and single data points (dots color coded by their respective box). The dashed black and red lines denote the mean and median of the percentage of novel protein families per genome in the 169,642 genomic collections, and the gray background shows their standard deviation. For example, AABM5 and Joyebacterota have the highest and lowest percentage of novel families. b Number of conserved novel protein families highly specific (specificity > 0.7) and widespread (coverage > 0.7) within each phylum are shown in dark purple bars. The number of novel protein families with conserved neighboring genes are shown in light gray bars. c, d, Selected examples of phylogenetic trees and novel protein family genomic context marked in gray with a black outline) in Blakebacterota and Arandabacterota. The protein families are similar between these two phyla and have conserved neighboring genes, including translation initiation factor IF-3 gene (infC), large subunit ribosomal protein L20 gene (rplT), phenylalanyl-tRNA synthetase genes (pheST), cell division protein gene (zapA), phosphodiesterase gene (ymdB), methenyltetrahydrofolate cyclohydrolase gene (folD), and exodeoxyribonuclease genes (xseAB). e Phylogenetic tree and genomic context of a novel protein family uniquely distributed in Joyebacterota. The novel protein family has conserved genomic neighbors related to energy conservation (Rnf complex genes, rnfABCDEG). The phylogeny was generated using FastTree2 and numbers on the top and bottom of the branch represent the bootstrap and branch length, respectively. Source data are provided as a Source Data file.

