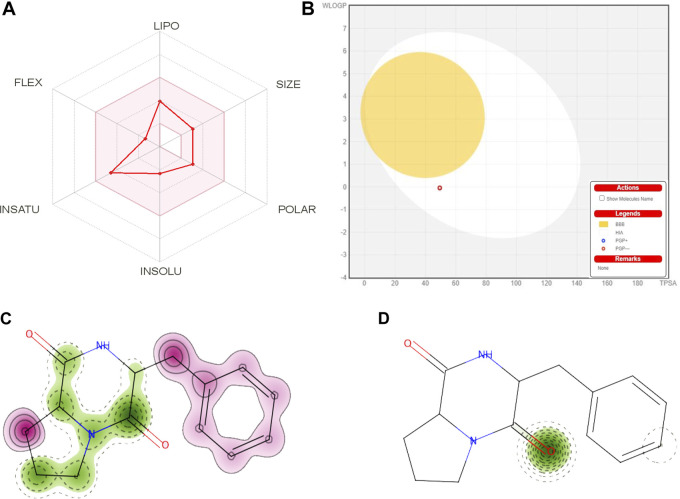
FIGURE 11.
(A) A radar graphic showing CDPDP’s bioavailability. The pink area indicates the physicochemical region for oral bioavailability, while the red stroke shows the parameters of oral bioavailability. (B) Swiss ADME online web tool for CDPDP predicted BOILED-Egg plot. Map of skin sensitization of CDPDP obtained from pred-skin. (C) h-CLAT (D) LLNA. The positive and negative contributions of individual atoms or pieces to the skin sensitization have been identified. The bright pink hue shows that an atom and fragment have made a detrimental impact on skin sensitization.

