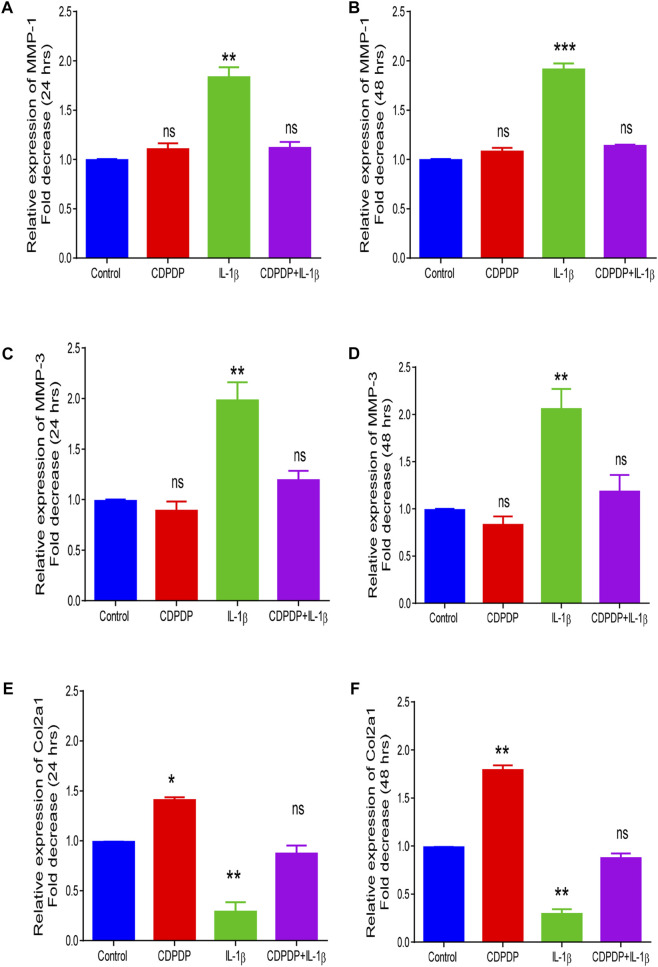
FIGURE 8.
Quantitative PCR analysis chromatogram. (A) MMP-1 after 24 h (B) MMP-1 after 48 h (C) MMP-3 after 24 h (D) MMP-3 after 48 h (E) Col2a1 after 24 h (F) Col2a1 after 24 h. Data is shown as mean ± SD (n = 3). Means with different superscripts in the columns are significantly (p < 0.05) different from one another.

