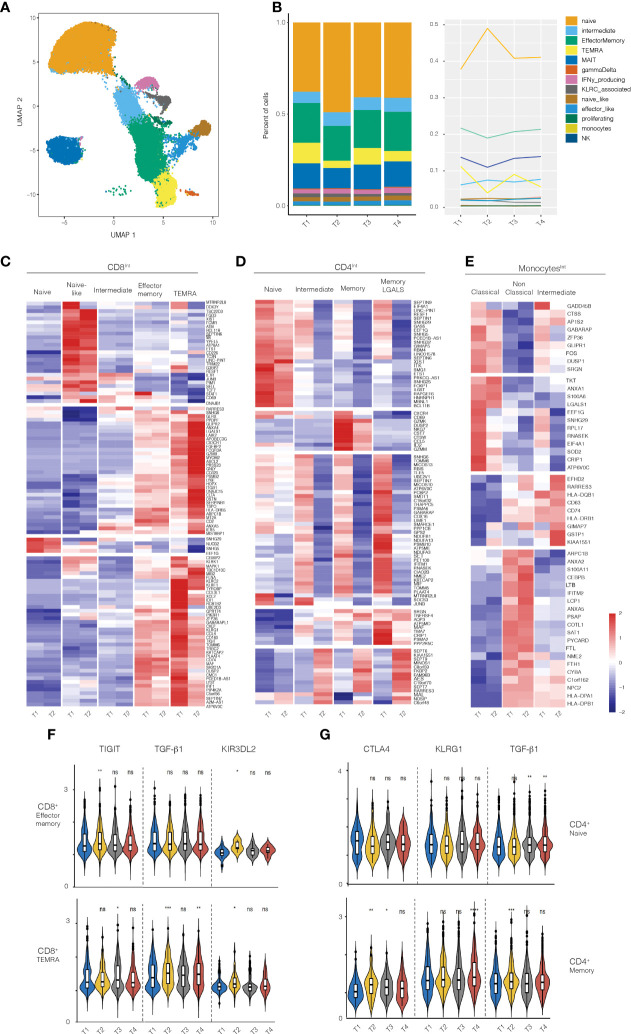
Figure 3.
RNA-seq analysis on PBMCs from healthy volunteers treated with 50ug of Foralumab. (A) Graphical depiction of the single cell analysis of the CD8+ population isolated from PBMCs showing the cell types that were defined by the clusters based on unbiased DEG the changes in CD8 maturational state subsets derived from the scRNA data in aggregated bar (B) graphs or line graph analyses. (C) Different maturational subsets of CD8 T cells show unique DEG between baseline (T1) and T2. Heatmap presentation of the genes that exhibited increased or decreased expression from baseline after Foralumab treatment. Gene expression values were used to separate the cells into naïve CD8 T cells, naïve-like CD8 T cells (differed from naïve in expression of top group of genes), intermediate CD8 T cells (exhibited features of both naïve and memory cells), effector memory, and TEMRA. (D) Different maturational subsets of CD4 T cells Gene expression values were used to separate the cells into naïve CD4 T cells, intermediate CD4 T cells (exhibited features of both naïve and memory cells), memory CD4, and memory CD4 with strong GALS1 gene expression. (E) Different functional subsets of monocytes. Gene expression values were used to separate the cells into classical, non-classical and intermediate subsets. (F) Violin plots showing changes in expression of TIGIT, TGFb1 and KIR3DL2 in CD8 effector memory and CD8 TEMRA cells. (G) Violin plots showing changes in expression of CTLA4, KLRG1, and TGFb1 in naïve CD4 T cells and memory CD4 T cells. Unpaired two-sided T-test against timepoint 1 (T1vT2, T1vT3, T1vT4) was used to get the posted significance score if it changed from the baseline. *p<0.05, **p<0.001, ***p<0.0001, ****P<0.0001, ns, not significant).

