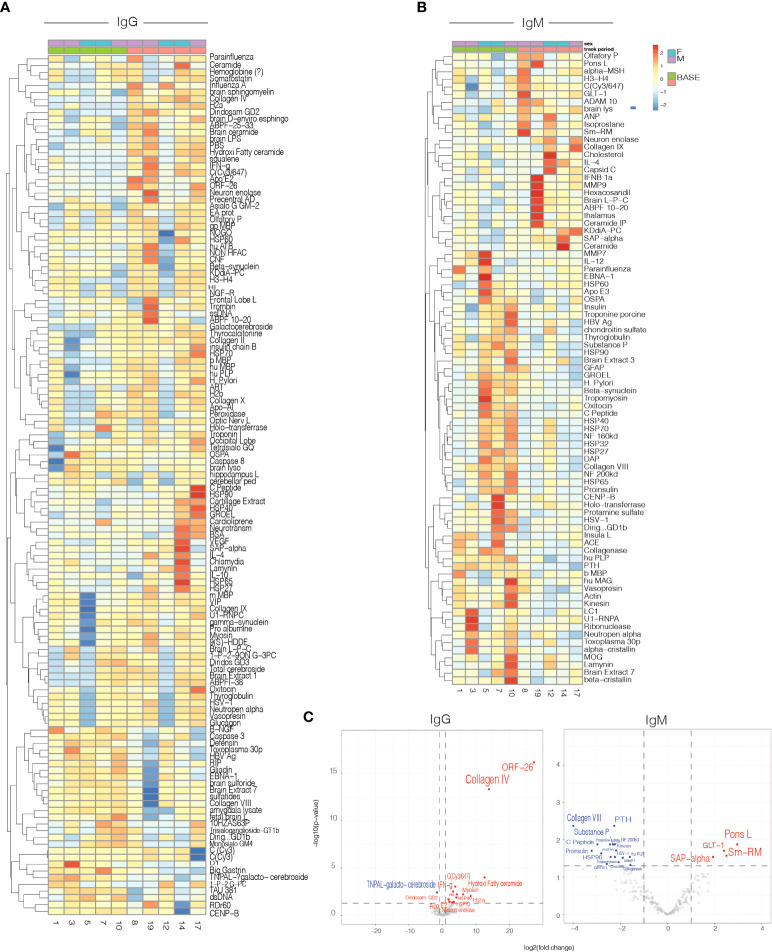
Figure 4.
Serum IgG and IgM antibody reactivity in patients treated with 50ug. Heatmap representing the mean delta change from Timepoint 1(baseline) to Timepoint 2 (day 7) for: IgG (A) and IgM (B) antibody reactivity in serum samples from patients. (C) Volcano plot representing differential IgG and IgM antibody reactivity. Cut-off criteria was defined as p-value < 0.05 and log2 fold change > 1 or < −1.

