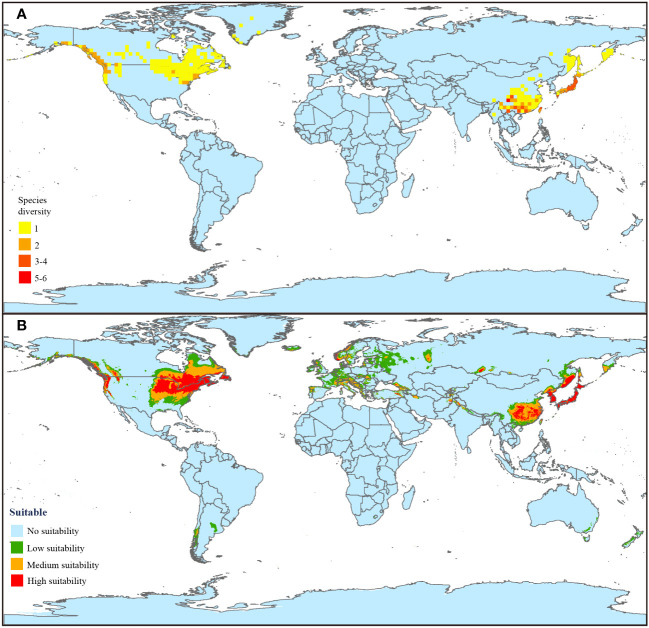
Figure 2.
Current distribution and suitable habitat prediction of Coptis. (A) Current species distribution and diversity pattern. The global land area was divided into 2° grid cell by ArcGIS and the number of species per grid were counted to determine the species diversity of Coptis. The redder the grid, the higher the species diversity. (B) Current potential distribution of Coptis under 1970–2000 climate conditions. Four levels of suitability are shown in different colors as follows: no suitability (0-0.2, blue); low suitability (0.2-0.4, green); medium suitability (0.4-0.6, yellow); and high suitability (0.6-1, red).

