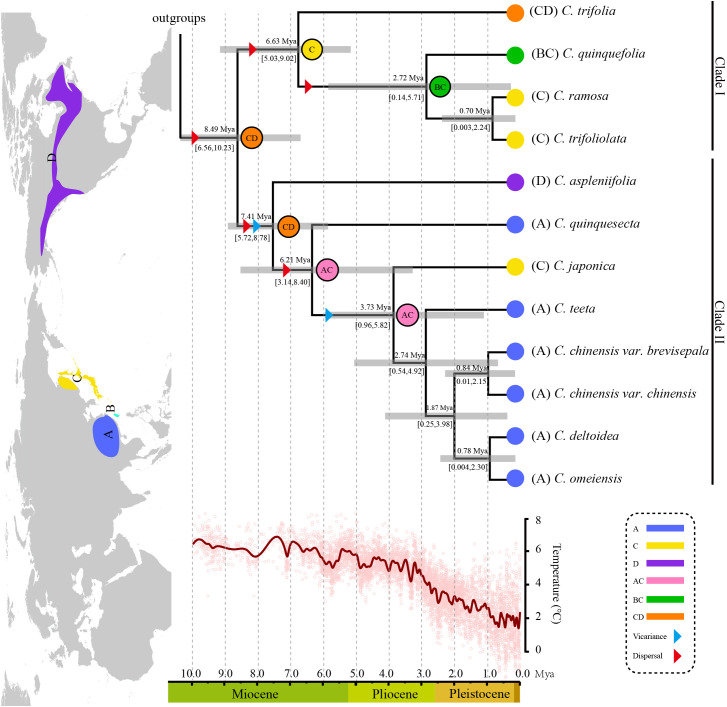
Figure 3.
Combined dating analyses and ancestral habitat reconstruction of Coptis. The global temperature change in the past 10 Ma was obtained from Zachos et al. (Zachos et al., 2008). The insert Northern hemisphere map indicates the species distribution of Coptis used in the reconstruction with four defined biogeographical areas as follows: (A) mainland China; (B), Taiwan island; (C), Japanese archipelago and a part of the Russian Far East; (D), North America. Dated phylogeny of Coptis was derived from Figure S6 . Numbers above and under the branches indicate the mean divergence times and 95% confidence interval of each node, respectively. Blue bars indicate the 95% highest posterior density intervals. Letters and colors in the legend represent extant ancestral areas and combination of them. Pie chart labeled with letters at each node indicates the most likely ancestral area.

