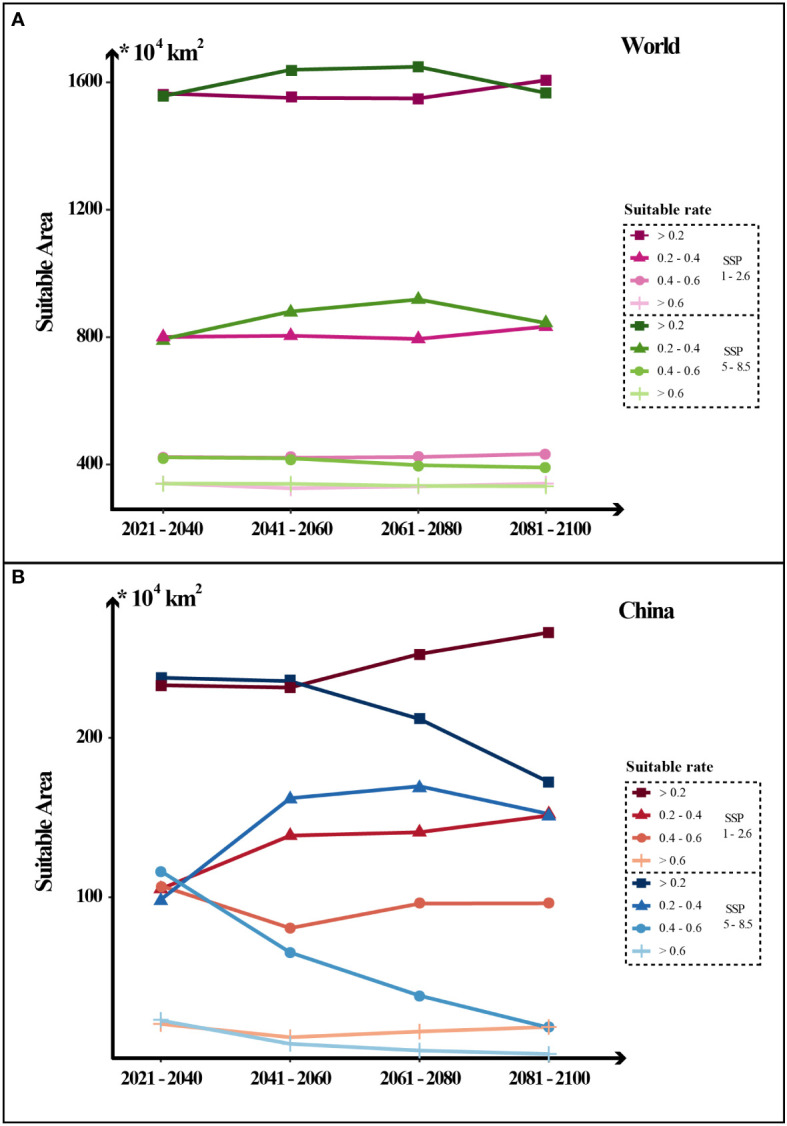
Figure 5.

Dynamic changes in the area of potential Coptis suitable distribution in the world and China in the future four periods under two greenhouse gas emission scenarios (SSP126 and SSP585). The levels of suitability are shown in different line types: low suitability (0.2-0.4); medium suitability (0.4-0.6); high suitability (0.6-1) and total suitability (> 0.2, the sum of high, medium and low levels).
