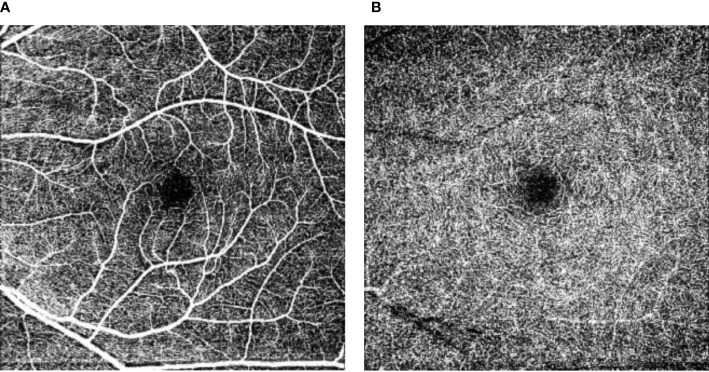
Figure 2.6.
Retinal vascular density and foveal avascular zone. Figure 2.6 shows the superficial capillary networks (A) and the deep capillary networks (B) in the perifoveal area. The central black area is the perifoveal avascular zone, where a larger perifoveal avascular area reflects less capillary perfusion at rest. In addition, from these images the capillary perfusion at rest can be estimated as the “vascular density”.

