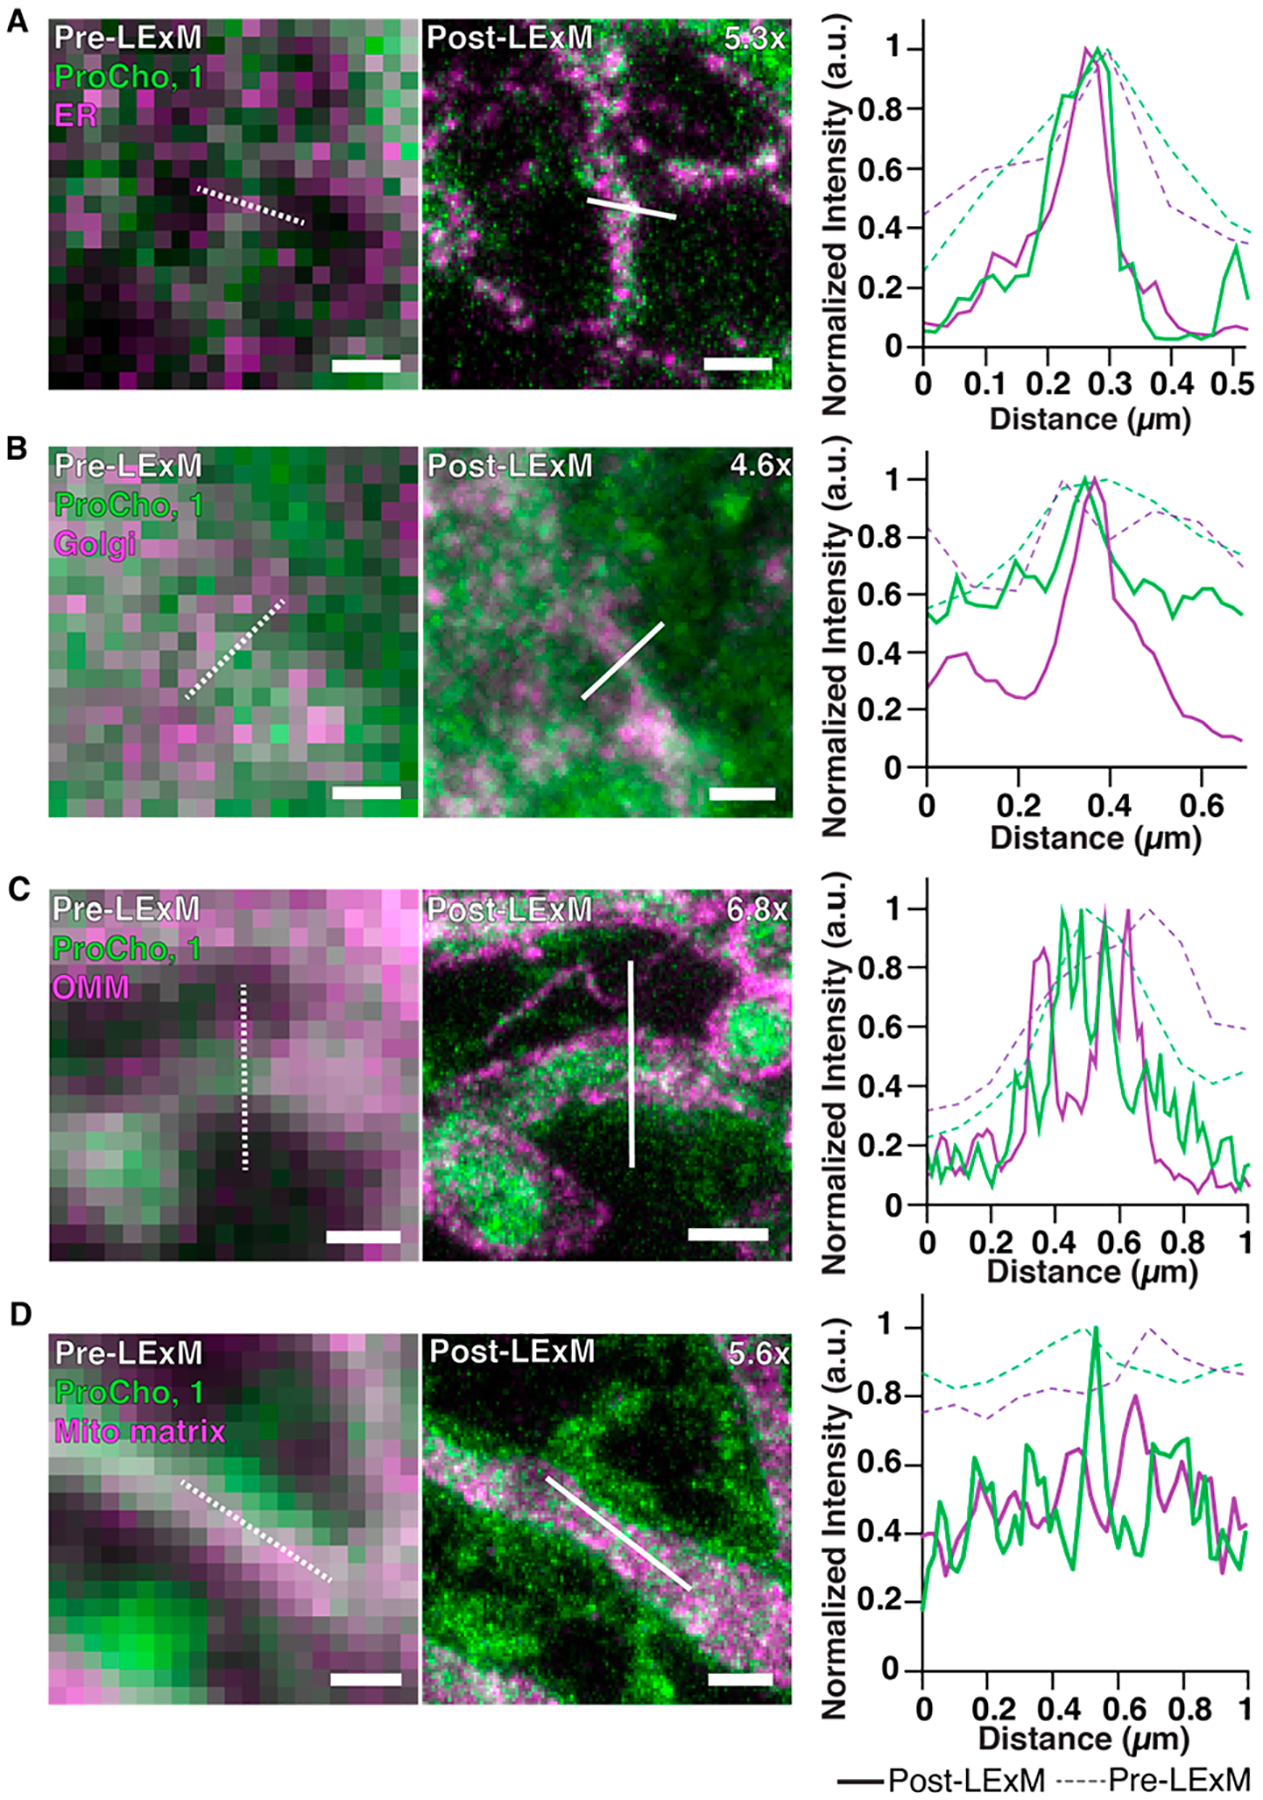
Figure 3.

Pre- (left) and post-LExM (middle) Airyscan confocal images of cells transfected with organelle marker (magenta); mRFP-Sec61β, ER (A); mCherry-PH(OSBP), Golgi complex (B); OMP25TMmCherry, outer mitochondrial membrane (OMM, C); mCherry-Mito7, mitochondrial matrix (D) then labeled with ProCho and 1 (green), with fluorescence intensity profile line plots of pre- (dotted line) and post-LExM (solid line) images. Expansion factors are displayed in post-LExM images. Dotted and solid lines indicate profiles measured for line plots. Scale bars (pre-LExM distance): 400 nm.
