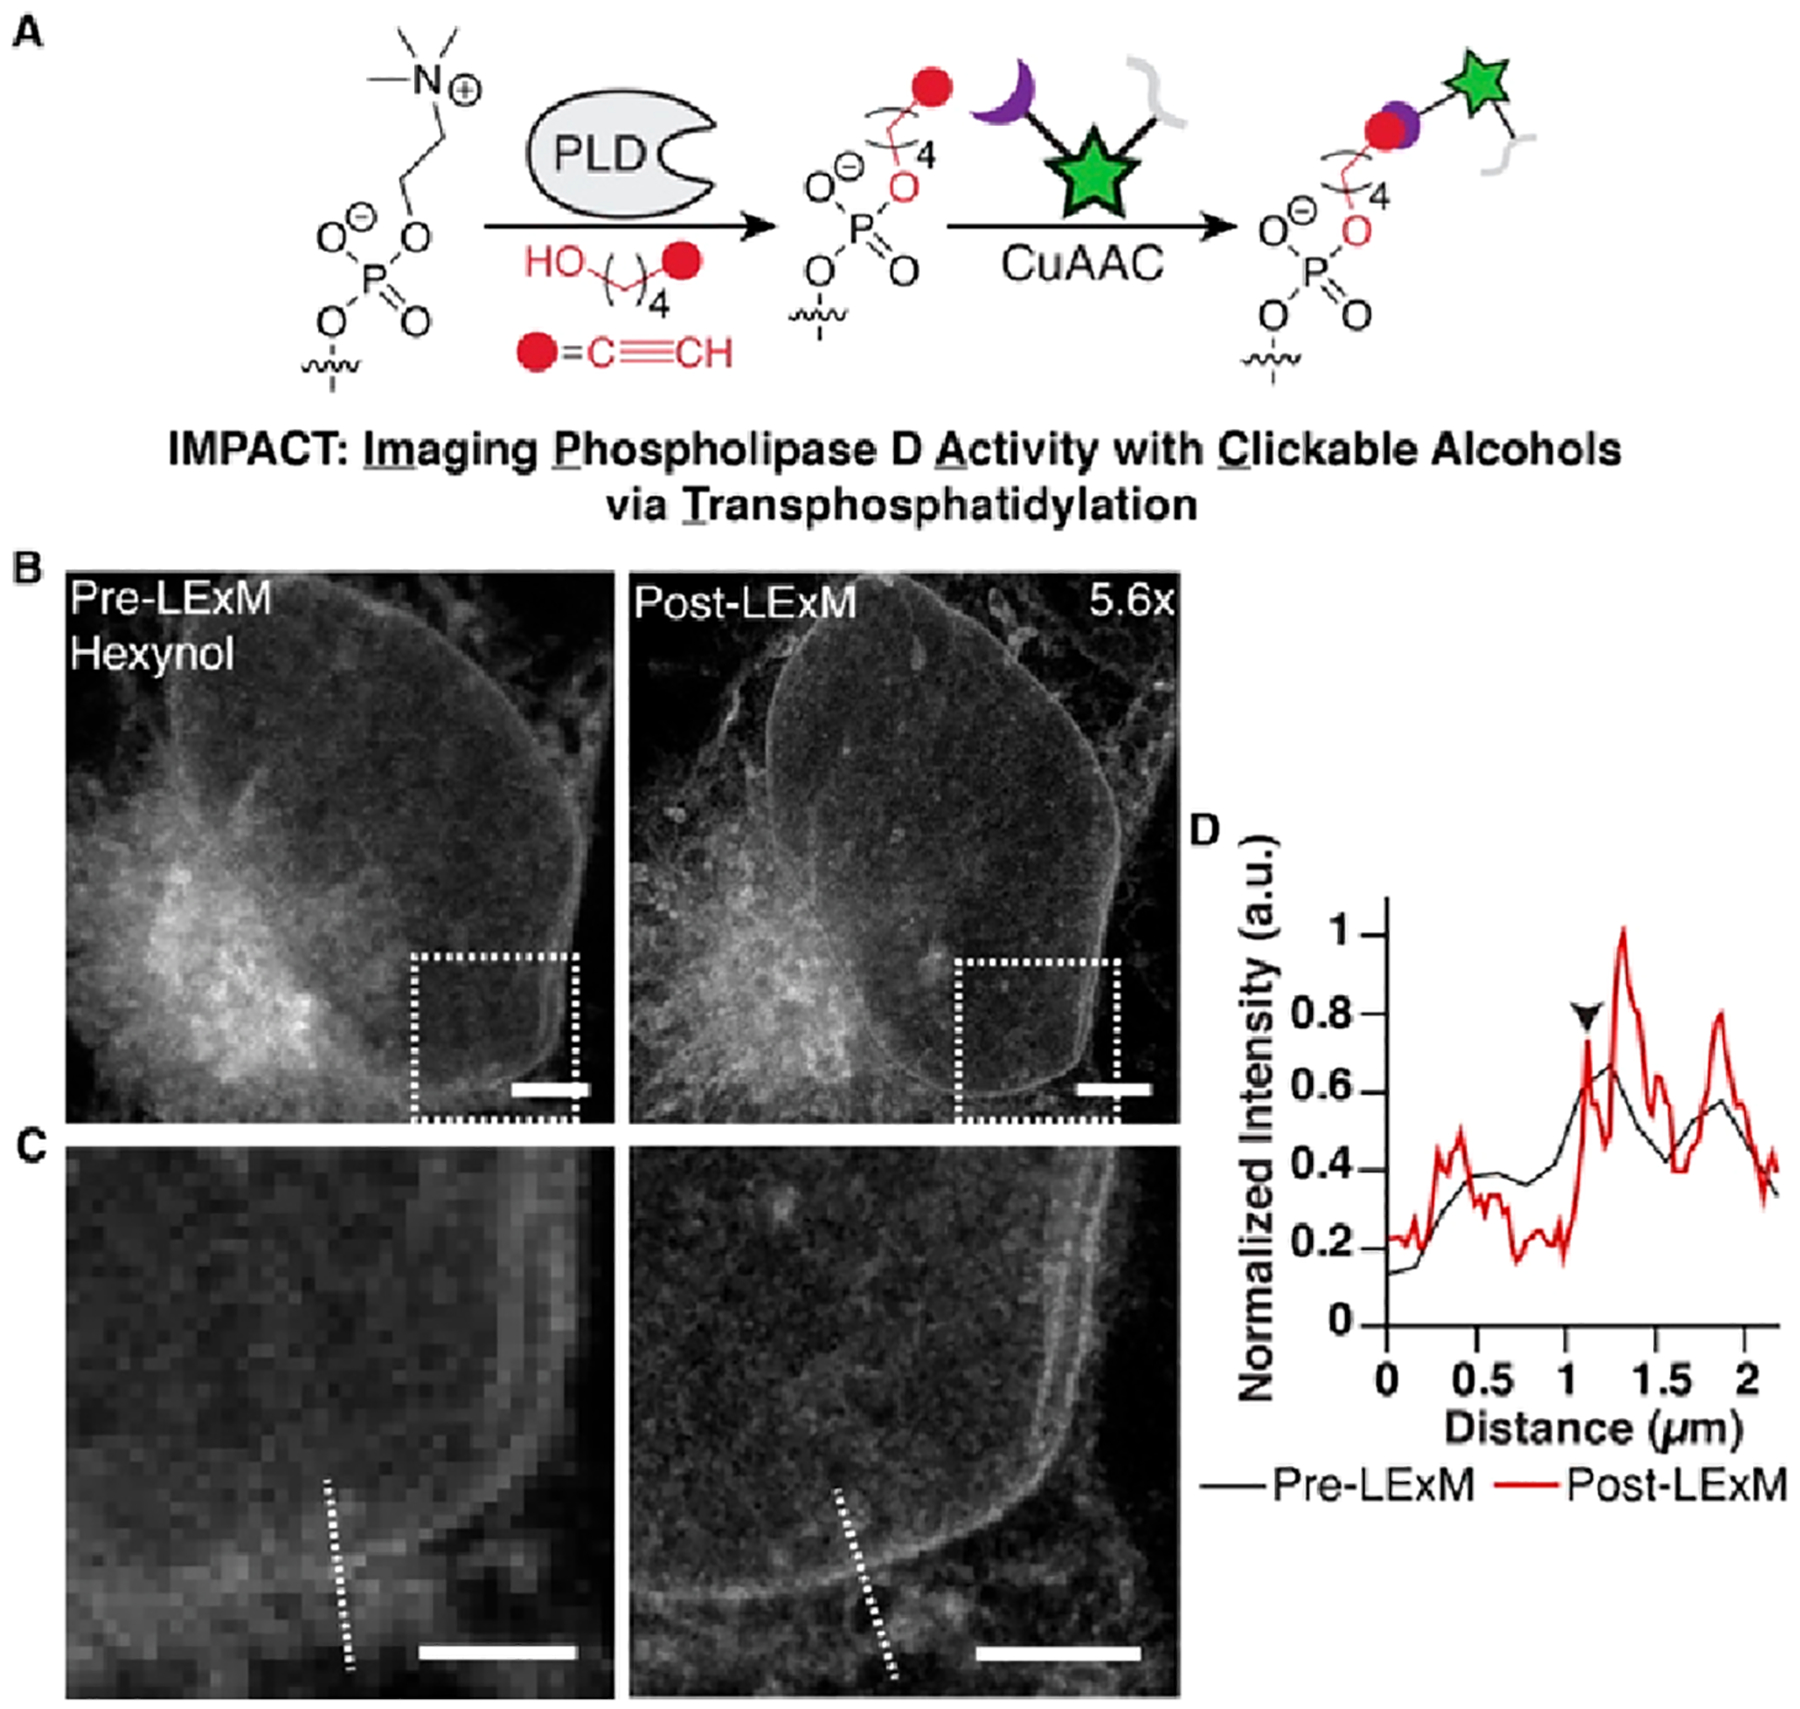
Figure 4.

(A) Cell labeling via IMPACT in the presence of hexynol followed by CuAAC tagging with 1. (B) Pre- (left) and post-LExM (right) confocal images of IMPACT-labeled cells. Expansion factor is displayed in the post-LExM image. (C) Pre-LExM (left) and post-LExM (right) boxed areas in B. Scale bars (pre-LExM distance): 3 μm (B) and 2 μm (C). (D) Fluorescence intensity profile line plot for dotted lines in pre- (black) and post-LExM (red) images. Arrowhead indicates nuclear envelope.
