
Figure 5.
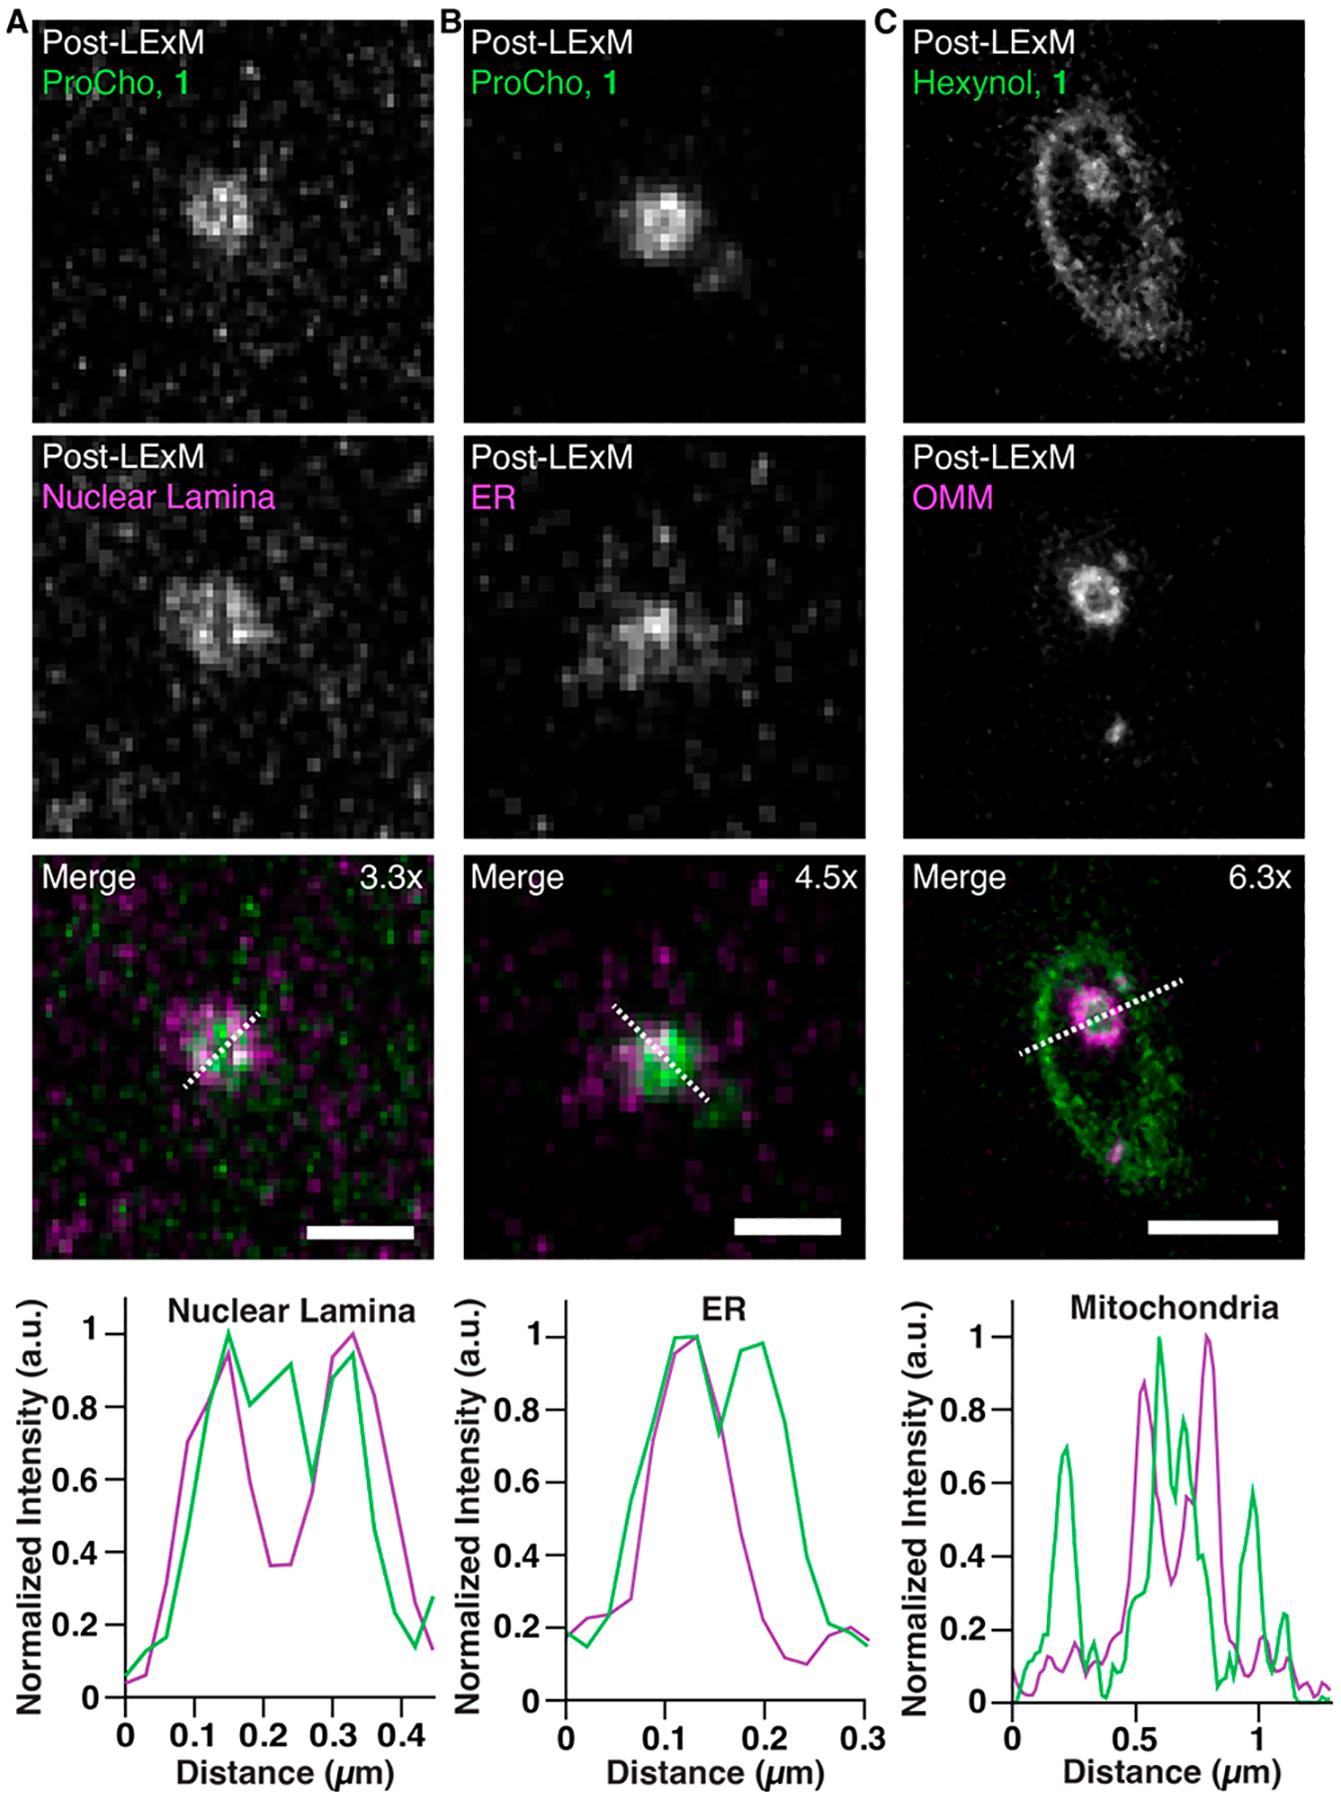
Airyscan confocal images of cells transfected with organelle markers (mRFP-Lamin A, nuclear lamina (A); mRFP-Sec61β, ER (B); OMP25TM-mCherry, outer mitochondrial membrane (OMM) (C)) and labeled with ProCho (A, B) or hexynol via IMPACT (C) and LExM using 1. Fluorescence intensity profile line plots were generated from dotted lines in merged images. Zoom-ins show lipids (top, green in merge), organelle markers (middle, magenta in merge), and merged image (bottom). Expansion factors are displayed in merged images. Scale bars (pre-LExM distance): 500 nm (A), 300 nm (B), and 1 μm (C).