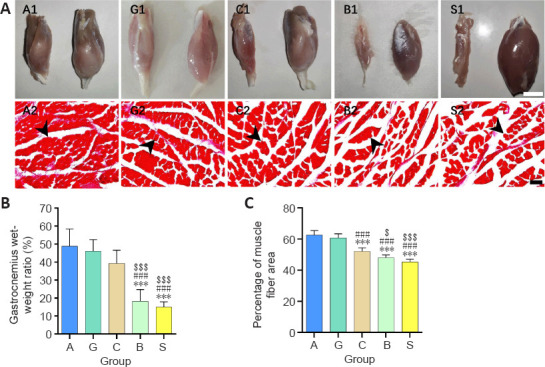
Figure 8.

Effect of the granular hydrogel nerve guidance conduit on the gastrocnemius muscle atrophy in rats with sciatic nerve injury 16 weeks after surgery.
(A) Gross appearance of the gastrocnemius muscles on the injured (left) and normal (right) sides (A1, G1, C1, B1, and S1). Masson’s staining of gastrocnemius muscles in each group (A2, G2, C2, B2, and S2). The gastrocnemius muscle of the injured side was visibly smaller than that of the normal side and Groups A and G showed more muscle fibers and less spacing between muscle fibers in the same view size field. Arrowheads indicate the positive muscle fibers. Scale bars: 1 cm (upper) and 100 µm (lower). (B and C) Comparisons of the gastrocnemius wet weight ratio (B) and the average percentage of the muscle fiber area (C). Data are shown as the mean ± SD (n = 6). ***P < 0.001, vs. Group G; ###P < 0.001, vs. Group A; $P < 0.05, $$$P < 0.001, vs. Group C (one-way analysis of variance followed by Tukey’s post hoc test). Group A: autologous nerve group; Group B: bulk hydrogel group; Group C: chitosan conduit group; Group G: granular hydrogel group.
