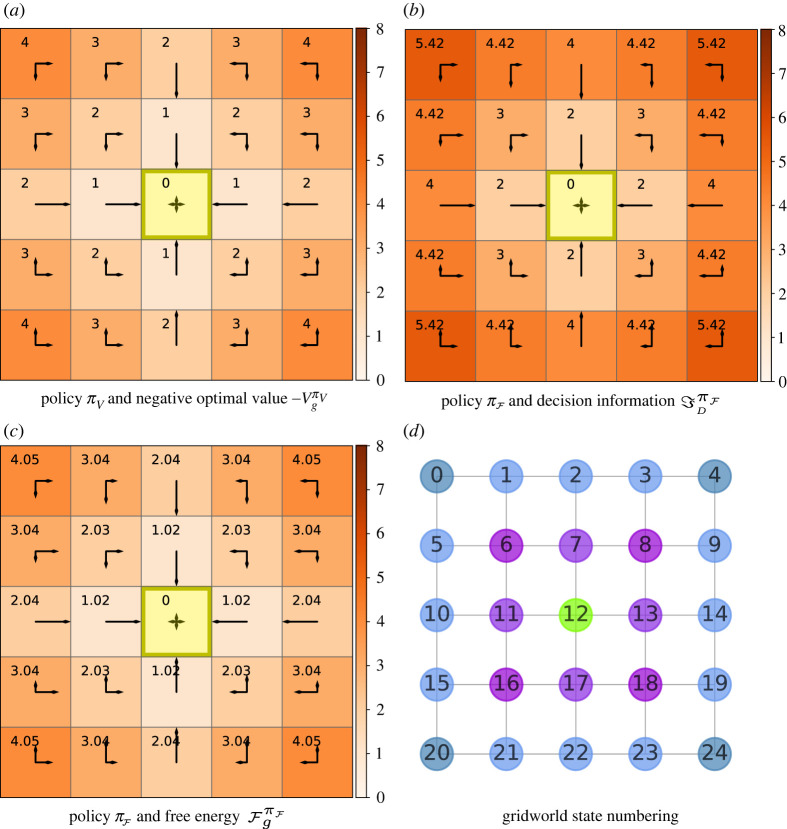
Figure 1.
Value, decision information and free energy plots in a 5 × 5 gridworld with cardinal (Manhattan) actions . The goal g = #12 is in the centre and is coloured yellow in the grid plots. The arrow lengths are proportional to the conditional probability π(a|s) in the indicated direction. The relevant prior, i.e. the joint state and action distribution marginalized over all transient states, is shown in the yellow goal state. (a) The policy displayed is the optimal value policy for all . The heatmap and annotations show the negative optimal value function for each state. (b) The policy presented is optimal with respect to free energy, i.e for all . The heatmap and annotations show decision information with β = 100. (c) The policy displayed is again with β = 100. The heatmap and annotations show free energy . (d) Graph showing the numbering of states in the gridworld, the goal is coloured in green and the other colours indicate levels radiating from the centre.

