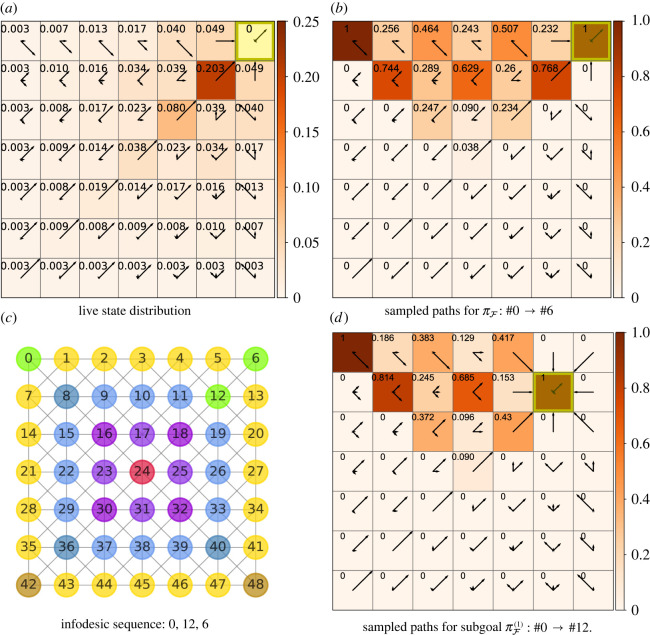
Figure 4.
Infodesic 7 × 7 gridworld with the Moore neighbourhood and the goal in the corner state #6 and β = 100. (a) A heat map showing the live state distribution, with the policy distribution denoted by arrows of length proportional to in the direction of the action. (b) The proportion of sampled sequences, comprised of contiguous states, for an agent following a single policy, , from S = #0 which pass through various states en route to the final goal S = #6. (c) A lookup grid with states labelled with their indices and infodesic sequence states highlighted in green. The deviation from the triangle inequality is given by the normalized free energy difference which is −0.0005. We observe informationally efficient states on the diagonal; furthermore, the policy guides the agent towards these states even if it requires the agent first navigating away from the edges. (d) The proportion of subgoaled sampled sequences, comprised of contiguous states, for an agent following a subgoal policy, , from S = #0 which pass through various states en route to the subgoal S = #12.

