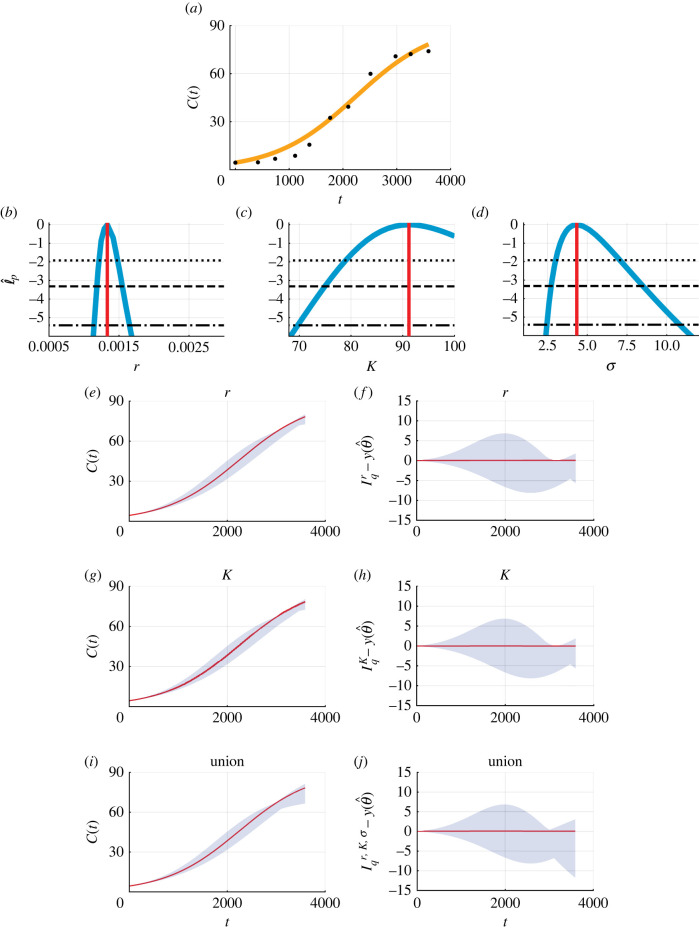
Figure 4.
Biphasic coral reef growth after a disturbance: fixing T = 0 and setting C(0) equal to the first measurement. (a) Comparison of the mathematical model simulated with the MLE (orange line) and field data (black circles) for the coral cover percentage, , measured at Broomfield Island, Great Barrier Reef, Australia. (b–d) Profile likelihoods for (b) r (days−1), (c) and (d) (blue) together with the MLE (vertical red line) and approximate 95% (dotted), 99% (dashed) and 99.9% (dash-dotted) confidence interval thresholds. The approximate 99.9% confidence intervals are as follows: (b) r ∈ (0.0011, 0.0017) (days−1), (c) and (d) . (e, g, i) Parameter-wise profile predictions for the mean (shaded) and the mathematical model simulated with the MLE (red). (f, h, j) Difference between parameter-wise profile predictions for the mean and the mathematical model simulated with the MLE. Results shown for (e, f) r, (g, h) K and (i, j) the union of the parameter-wise profile predictions.

