Figure 5.
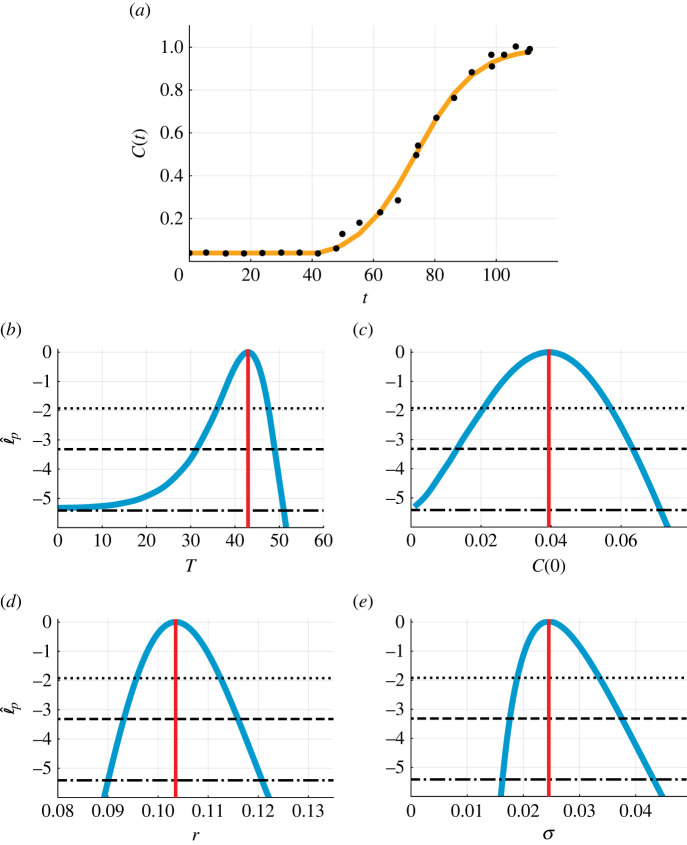
Biphasic population growth in a two-dimensional cell proliferation assay. (a) Comparison of the mathematical model simulated with the MLE (orange line) and experimental data (black circles) for the normalized cell density, C(t) (−). (b–e) Profile likelihoods for (b) T (hours), (c) C(0) (−), (d) r (hours−1) and (e) σ (−) (blue) together with the MLE (vertical red line) and approximate 95% (dotted), 99% (dashed) and 99.9% (dash-dotted) confidence interval thresholds. The approximate 99.9% confidence intervals are as follows: (b) T ∈ (0.0, 51.0) (hours), (c) C(0) ∈ (0.001, 0.071) (−), (d) r ∈ (0.090, 0.121) (hours−1) and (e) σ ∈ (0.016, 0.043) (−).

