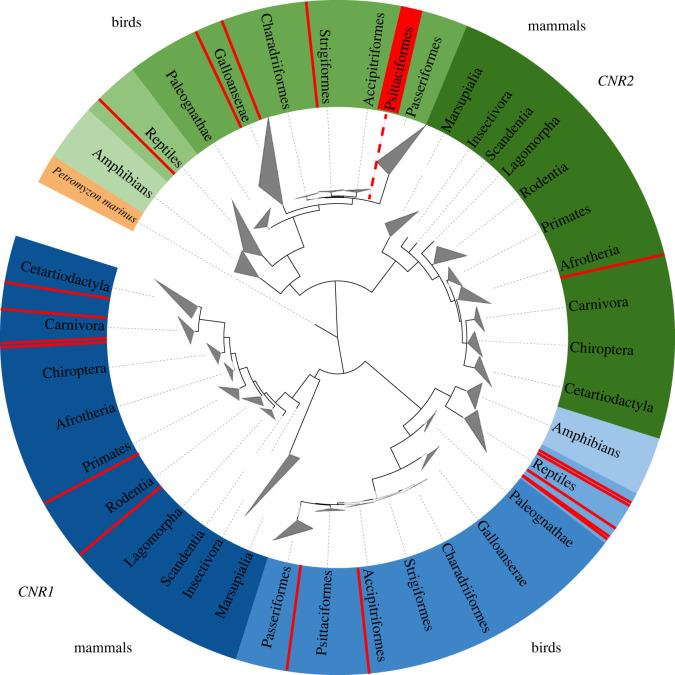
Figure 1.
Phylogenetic tree showing gene-specific clustering of CNR1 (blue) and CNR2 (green). Lamprey (orange) shows the root of the tree as a common ancestor of the genes. Terminal triangles represent collapsed taxon-specific branches. The red colour highlights the presence of species with missing receptors (i.e. cases where the receptors were not revealed in the database search). A fully expanded tree is provided in the electronic supplementary material, figure S1).

