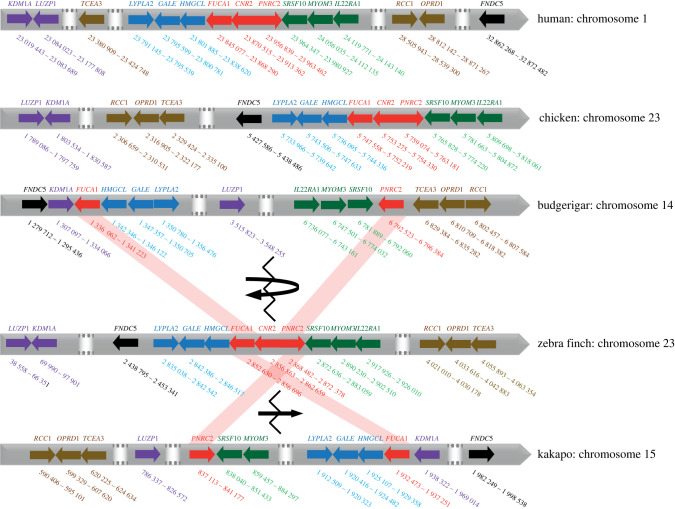
Figure 2.
Schematic of the CNR2 locus position and its neighbourhood in the human, chicken, budgerigar, zebra finch and kakapo genomes. Chromosome sequence is schematically indicated with the grey arrowed line over which positions of individual genes are indicated by colourful arrows (each colour represents one group of genes sitting in proximity in the ancestral state); CNR2 and its closest human, chicken and zebra finch neighbouring genes, FUCA1 and PNRC2, are marked in red and linked by red shades between the species. Each gene is labelled with its symbol above the arrow and its chromosomal location is marked below. White areas with the dotted grey lines indicate longer interspacing regions containing additional genes that are not important for the reconstruction of the chromosomal rearrangements in parrots. The recombination breakpoint in CNR2 is indicated by a broken line, a curved arrow indicates the inversion event that occurred in the budgerigar evolutionary lineage, while a straight arrow indicates the translocation event that putatively occurred independently in the kakapo evolutionary lineage.

