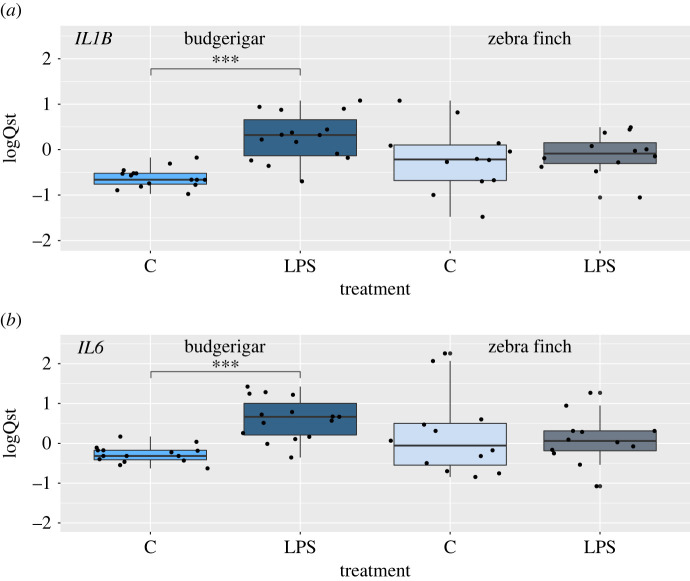
Figure 4.
Expression of (a) IL1B and (b) IL6 following peripheral stimulation with LPS in the brains of budgerigars and zebra finches. Gene expression assessed based on RT-qPCR is shown as centred standardized relative expression (logQst) values, i.e. species population average is equal to 0. C = controls, LPS = LPS-stimulated treatments. Statistically significant differences (p ≪ 0.001; electronic supplementary material, table S11 in SM1) are marked with asterisks. (Online version in colour.)

