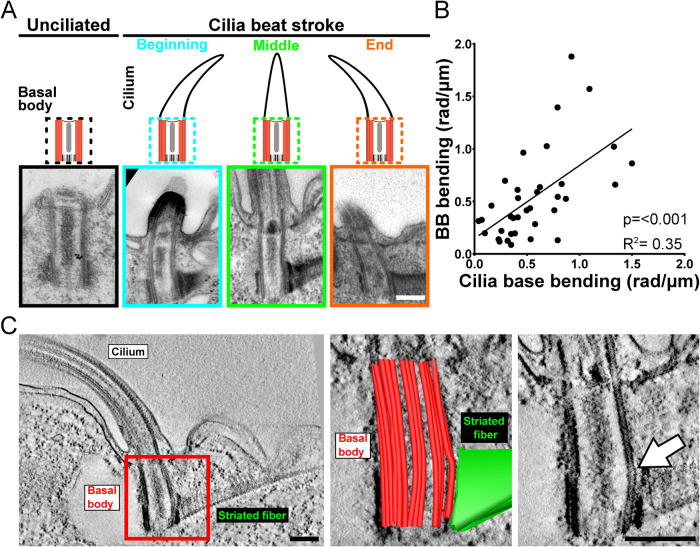
FIGURE 1:
BBs bend consistent with ciliary bending. (A) Thin (80 nm)-section EM images of T. thermophila BBs show triplet MT bending at 37°C. Schematic and representative images of cilia and BB position. Unciliated BB triplet MTs are straight. Conversely, ciliated BB triplet MTs bend corresponding to the direction of the ciliary bending. (B) Increased cilia bending correlates with increasing BB bending (p < 0.001, R2 = 0.35). The absolute maximum BB bending (rad/μm; y-axis) is measured relative to absolute maximum ciliary bending (rad/μm; x-axis) at the proximal end (Supplemental Figure S1C). n = 37 BBs. (C) Representative 3D EM tomography image of a BB and cilium at the end of the power stroke. Left panel displays cilium, BB, and SF. Middle image is a single-slice view of a model overlay of the BB triplet MTs (red) and SF (green) using 3D modeling. Right image displays single-slice view without the model. White arrow denotes the bending triplet MTs. Scale bars, 200 nm.

