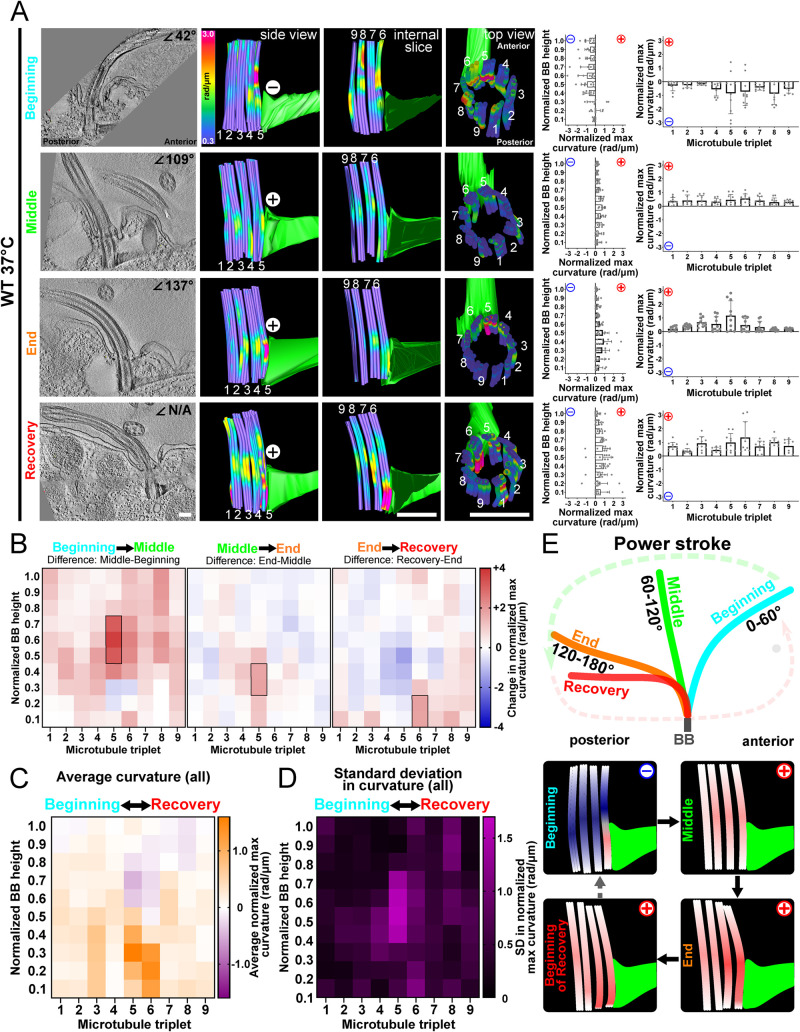
FIGURE 2:
BB bending is consistent with ciliary beat stroke position. (A) BB triplet MTs display unique bending patterns relative to cilia beat stroke position. Left panels are 8.6 nm max-projected images of EM tomograms. Middle panels are model views (side, internal slice, and top views) of corresponding BBs. Curvature of the triplet MTs where cold colors (blue) indicate low curvature and warm colors indicate high curvature (red). Graphs represent the normalized maximum BB curvature for the BB proximal to distal axis (left) and for each triplet MT (right). The maximum value for each bin (1/10th the length of the BB) along the BB proximal-distal axis is normalized by subtracting the lowest maximum value of all bins in each BB. Each graph represents the means and SDs of normalized maximum values for each proximal to distal bin (left) or each triplet MT (right) for a single BB, with 27 tubules averaged into nine triplet MTs. (B) Differences in BB bending through the ciliary beat cycle. In the first half of the power stroke, BB bending increases in the positive direction in the middle of triplet MT 5 (left heatmap). In the second half of the power stroke, BB bending increases in the positive direction at the base of triplet MT 5 (middle heatmap). In the transition from the power stroke to the recovery stroke, BB bending is observed at the base of triplet MTs 6–8 where bending becomes more positive (right heatmap). Black boxes denote >75% difference from other bins (p > 0.05). Blue (negative) and red (positive) indicate the direction of curvature relative to the cell’s anterior–posterior axis. (C) Average BB bending at all ciliary positions is greatest at triplet MTs 5 and 6. Heatmap indicates the average of normalized maximum curvature values from the four BBs in A. Purple indicates negative bending, and orange indicates positive bending. The greatest positive and negative bending occurs in triplet MTs 5 and 6, indicating that these triplet MTs experience the greatest structural deformations. (D) Heatmap indicates the SD in the normalized maximum curvature values from the four BBs in A. The greatest SD to BB bending occurs in the middle and at the base of triplet MTs 4–6. Magenta indicates high SD. (E) Schematic models represent cilia and BBs through the power stroke (beginning, middle, and end) and the onset of the recovery stroke. Scale bar, 200 nm.

