FIGURE 3:
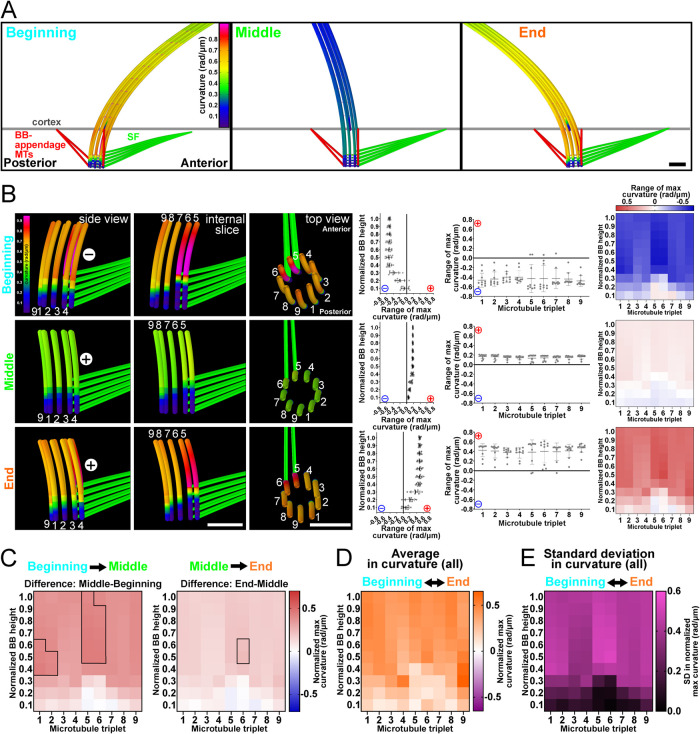
Computer model of BB bending relative to ciliary bending. (A) Computational model depicting the cilium, BB, SF, and BB-appendage MTs during the ciliary power stroke to determine the parameters required to simulate BB bending. (B) Computational modeling can approximately replicate BB bending profiles observed in the EM tomograms. Bending occurs at triplet MTs 5 and 6. Left panels are model views (side, internal, and top) of BB triplet MTs. Colors indicate curvature of the modeled triplet MTs where cold colors (blue) indicate low curvature and warm colors (red) indicate high curvature. Graphs show BB curvature for the BB proximal to distal axis (left) and for each triplet MT (right) as quantified in Figure 2. Left heatmap describes the bending amplitude and direction for each representative modeled BB. (C) BB bending changes with ciliary power stroke position. BB bending becomes more positive in the middle of triplet MTs 1 and 2 and middle/top of triplet MTs 5 and 6 in the first half of the power stroke (left heatmap). BB bending becomes more positive in the middle of triplet MT 6 in the second half of the power stroke (right heatmap). Black boxes denote >75% difference from other bins (p > 0.05). Blue (negative) and red (positive) colors indicate the direction of curvature relative to the cell’s anterior–posterior axis. (D) Average BB bending of all ciliary positions. (E) Heatmap indicates the SD in the maximum curvature values from computer modeled BBs. The largest SD occurs at triplet MTs 5 and 6. Magenta indicates high SD. Scale bar, 200 nm.

