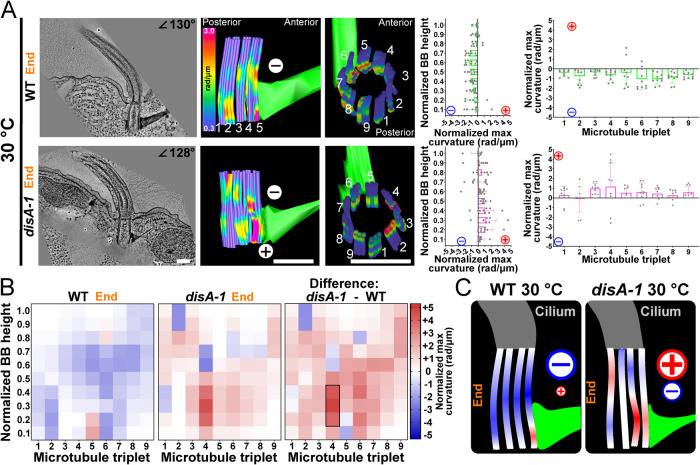
FIGURE 5:
SFs focus bending within the BB. (A) The direction and location of BB bending at the end of the power stroke changes in disA-1 mutants that have short SFs and are disconnected from neighboring BBs and the cell cortex. The graphs represent the means and SDs of normalized maximum values for each proximal to distal bin (left graph) or each triplet MT (right graph) as in Figure 2. (B) SF connections promote consistent negative bending focused at triplet MTs 5 and 6. Left heatmap shows a 30°C WT BB curvature. The middle heatmap shows a 30°C disA-1 BB curvature. Right heatmap quantifies the difference in triplet MT bending between WT and disA-1 BB curvature, where the greatest difference is in the elevated positive bending in triplet MT 4. Black box denotes >75% difference from other bins (p > 0.05). (C) Schematic model showing that SF connections are important for negative BB curvature and focused bending at triplet MTs 5 and 6. disA-1 BBs exhibit both positive and negative curvature, with positive curvature predominating across the BB. Scale bar, 200 nm.

