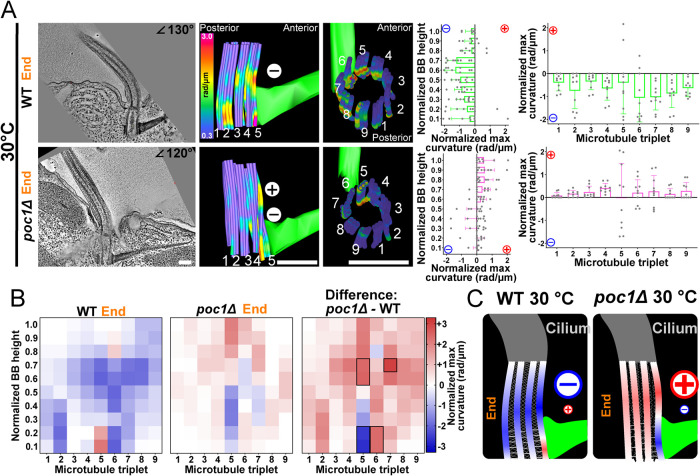
FIGURE 6:
Poc1 distributes coordinated BB bending. (A) The direction and location of BB bending at the end of the power stroke changes in poc1Δ at 30°C. Middle panels are model views (side and top) of BB triplet MTs from the corresponding EM tomogram. The graphs represent the means and SDs of normalized maximum values for each proximal to distal bin (left graph) or each triplet MT (right graph) as in Figure 2. (B) poc1Δ BBs show both positive and negative bending focused on triplet MT 5. Left heatmap shows 30°C WT BB curvature. Middle heatmap shows 30°C poc1Δ BB. Right heatmap quantifies the difference between WT and poc1Δ BBs. The greatest difference occurs in triplet MTs 5–7, which display curvature in opposing directions Blue (negative) and red (positive) colors indicate the direction of curvature relative to the cell’s anterior–posterior axis. Black boxes denote >75% difference from other bins (p > 0.05). (C) Schematic model of triplet MT connections as important for BB bending patterns. poc1Δ BBs have high positive and negative curvature on triplet MT 5 that is not effectively propagated across the BB. Scale bars, 200 μm.

